
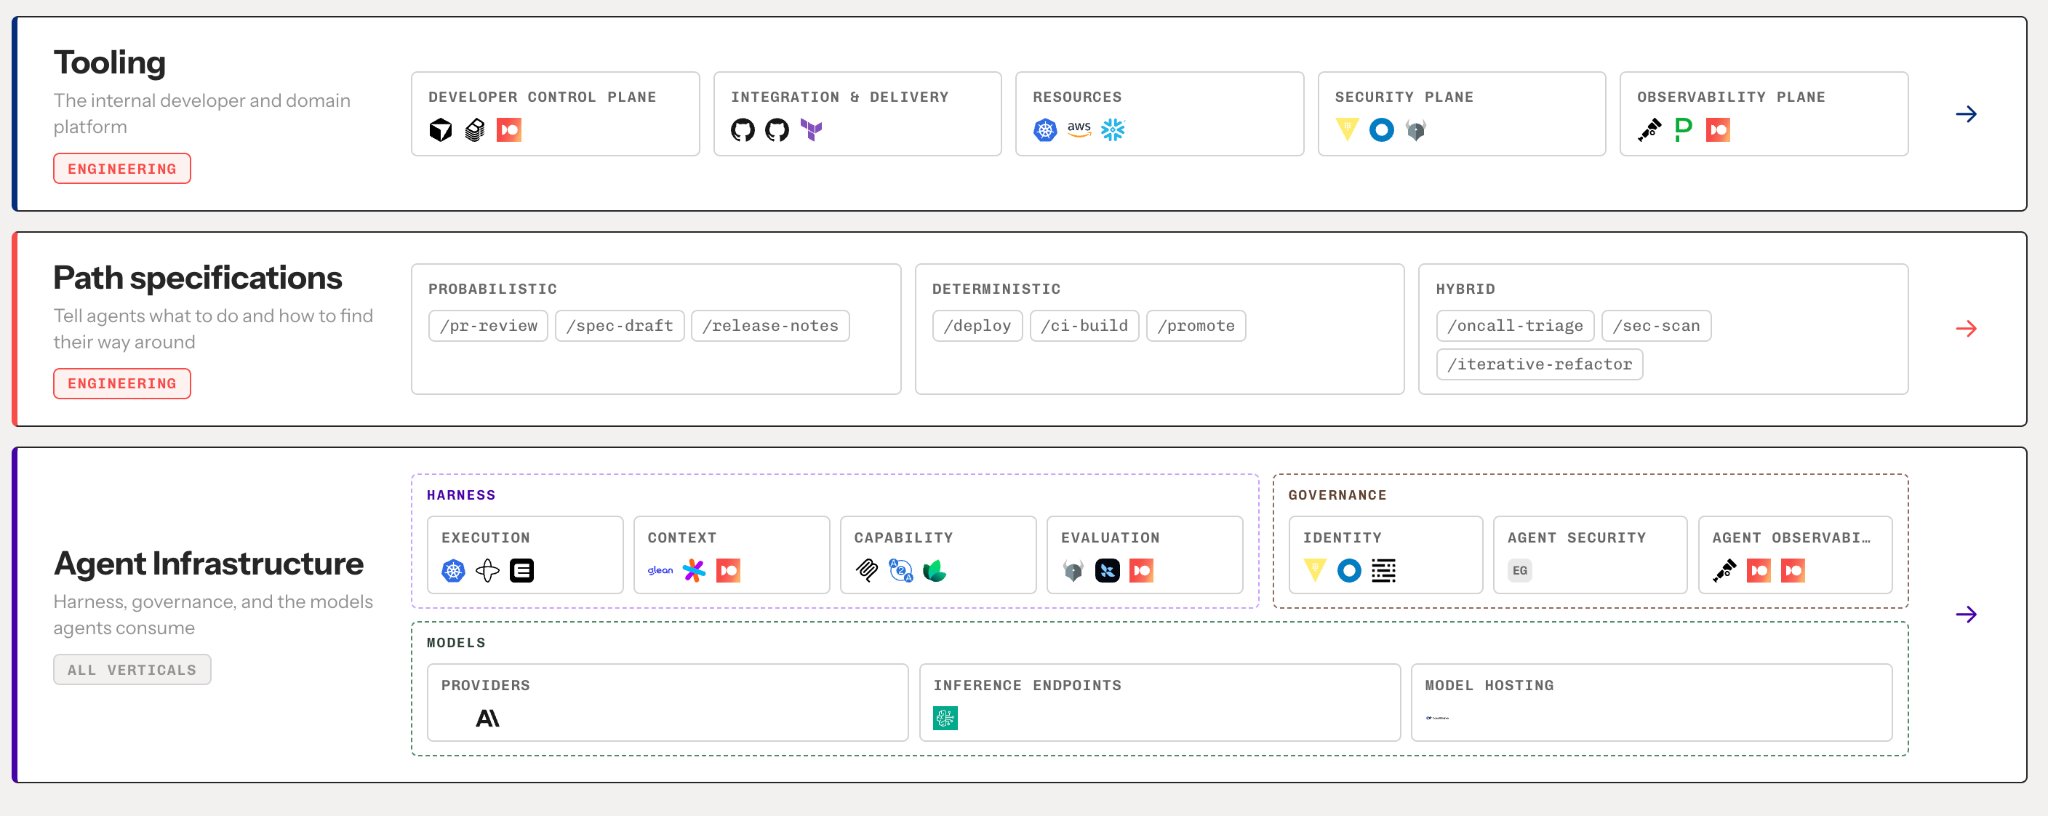
Tracing was always the one signal that followed a request across the teams that own its parts. Most platform teams put it last anyway, because logs and metrics were cheaper to get and the person reading the dashboard could stitch the rest together, a classic case of tribal knowledge! Two things break that bargain: Platforms now serve dozens of autonomous teams whose failures cross ownership lines, and they are about to get a second reader who doesn't read dashboards at all. Tracing is a platform decision, not a tooling decision. This piece shows where it sits on the reference architecture and ends with two tests you can run on any vendor you are talking to.
Tracing first is a platform decision
Every platform team I talk to made the same decision by default, and I made it too. We instrumented logs and metrics first, enjoyed the fact that Prometheus gave us metrics for free, ELK or Loki gave us logs, alerting ran on both, and tracing meant touching code and propagating context across every service in the estate. So tracing went to the bottom of the stack, and I don’t directly think this was a mistake but rather the rational order for a platform whose only user was a person.
There are a lot of things in motion in the discipline of platform engineering yet the fundamental design of Internal Developer Platforms stays the same. The two main factors listed above lead to making this foundation a necessity. Our State of AI in Platform Engineering report this month puts it well: "AI amplifies the system you already have, and the platform is the prerequisite."
Yet, looking strictly at the IDP, one plane is different: the observability plane. This one actually needs to change because it was designed around a person reading things. Someone opens a dashboard, knows which of the services on it is theirs, and stitches metrics, logs, and traces together in their head. Dashboards, alert channels, one log index per team, the ticket you file so an SRE can look for you: every one of those assumes that reader.
The sheer size and autonomy of users on your platform and the fact that agents are joining the scene make tracing the first observability capability your platform provides by default, not the last one a team gets around to. This change will pay for itself before the first agent shows up but the agents in addition remove the option of waiting.
Logs and metrics serve the reader, traces serve the request.
Picture an organization that took "you build it, you run it" literally. Dozens of vertical teams, each owning its services from the first commit to the 3 a.m. page, each with the dashboards, the log index and the alert rules that team chose. It is a good way to run engineering, and it produces one specific blind spot.
A log records an event inside one service: this handler threw at 14:02. A metric says a number moved: p99 on checkout went from 200 milliseconds to 1.4 seconds. Neither tells you which of the services on the request path caused it, or in what order.
The checkout request that fails on a Friday afternoon crosses six of those boxes: edge, catalog, cart, pricing, payment, order. Nobody owns it end to end, because ownership follows the service, not the request. Every team's dashboard is green except one, and that one is downstream of the cause. In our observability research, 57% said their setup produces too much noise or doesn't help them find root cause.. This is what that number looks like on a Friday.
At a few deploys a day, this was fine. A senior engineer could stitch the story together across six dashboards in an hour, and the cost was one person's afternoon.
The platform got a second user
Now, in the last twelve months, the platform got a second user: the coding agent. Most platform teams answered by adding a chat window to the portal. Few asked what that user needs from each plane. For the observability plane, the answer changes the plane.
The first change is volume. When agents write code, the number of services, deploys, and changed code paths grows faster than any team can instrument by hand. Team-by-team coverage stops keeping up. Our Market Guide on observability found that organizations that adopted agentic coding heavily already report measurable increases in incident rates, and that only 18% have automated more than half of their observability tasks. Generation industrialized. Instrumentation didn't.
The second change is consumption: When agents read production, they don't open a dashboard. They run ten to twelve hypotheses in parallel, each one querying your telemetry endpoints, and they need signals they can navigate without a person explaining which panel means what: consistent names, resource attributes, a trace ID that ties a log line to a span.
Of the three signals, only the trace carries the path of a request and the context around it. It is the one an agent can follow from symptom to cause without a human translating. A log needs the human to know where to look. A metric needs the human to know what normal was.
This changes what OpenTelemetry is for. It stops being an argument about lock-in and becomes the precondition for agents to read your system at all. The models were trained on OTel's semantic conventions; they can find service.name and http.response.status_code without being told. Today 37% of platform teams have fully replaced proprietary agents with OTel, 43% run a hybrid, and 20% are still proprietary only. That last group is accumulating a debt that compounds every time an agent tries to read their telemetry and can't.
Asked what most obstructs scaling AI, the industry put platform readiness first at 27%, ahead of cost, review bandwidth and model capability. Nobody is waiting for a better model.
Shift tracing down into the platform
The platform answer is the one it always is. Shift the work down into the platform so every service gets it by default, instead of asking each team to put tracing on its backlog.
There are mostly four mechanics that facilitate this: The OpenTelemetry Operator injects instrumentation through an annotation on the deployment manifest, no code change, which is how you cover the services nobody will ever touch again. Semantic conventions become a versioned contract the platform enforces, so service.name means the same thing in every team. Tail sampling runs in your environment before egress, keeps every error and slow request, drops the routine, and is what makes tracing affordable at scale. Golden defaults ship the alert rules, dashboards and exporters pre-wired.
Logs and metrics stay exactly where they are. They attach to the trace through the trace ID and the shared resource attributes, and the trace becomes the spine you follow from a metric alert to the slow span to the log line that explains it.
The developer gets correlated telemetry on day one without filing a ticket. The agent gets the same data in the same shape without anyone building it an integration. Same platform, two users, one default. Almost half of the platform teams we surveyed describe their philosophy as shift-down. Fewer than one in five have done it for observability.
Access is not reach
There are two ways to let an agent into your platform. The first puts an MCP endpoint in front of a tool so the agent can ask it questions. The second gives the agent reach across the platform and lets it act only through paths the platform defines. They look the same in a demo but if you are using the tools in reality they are not the same thing at all.
Reach means the agent can read production telemetry, cluster state, the code and the cloud APIs, and that it acts only through governed paths, so it cannot do anything the platform has not already specified.
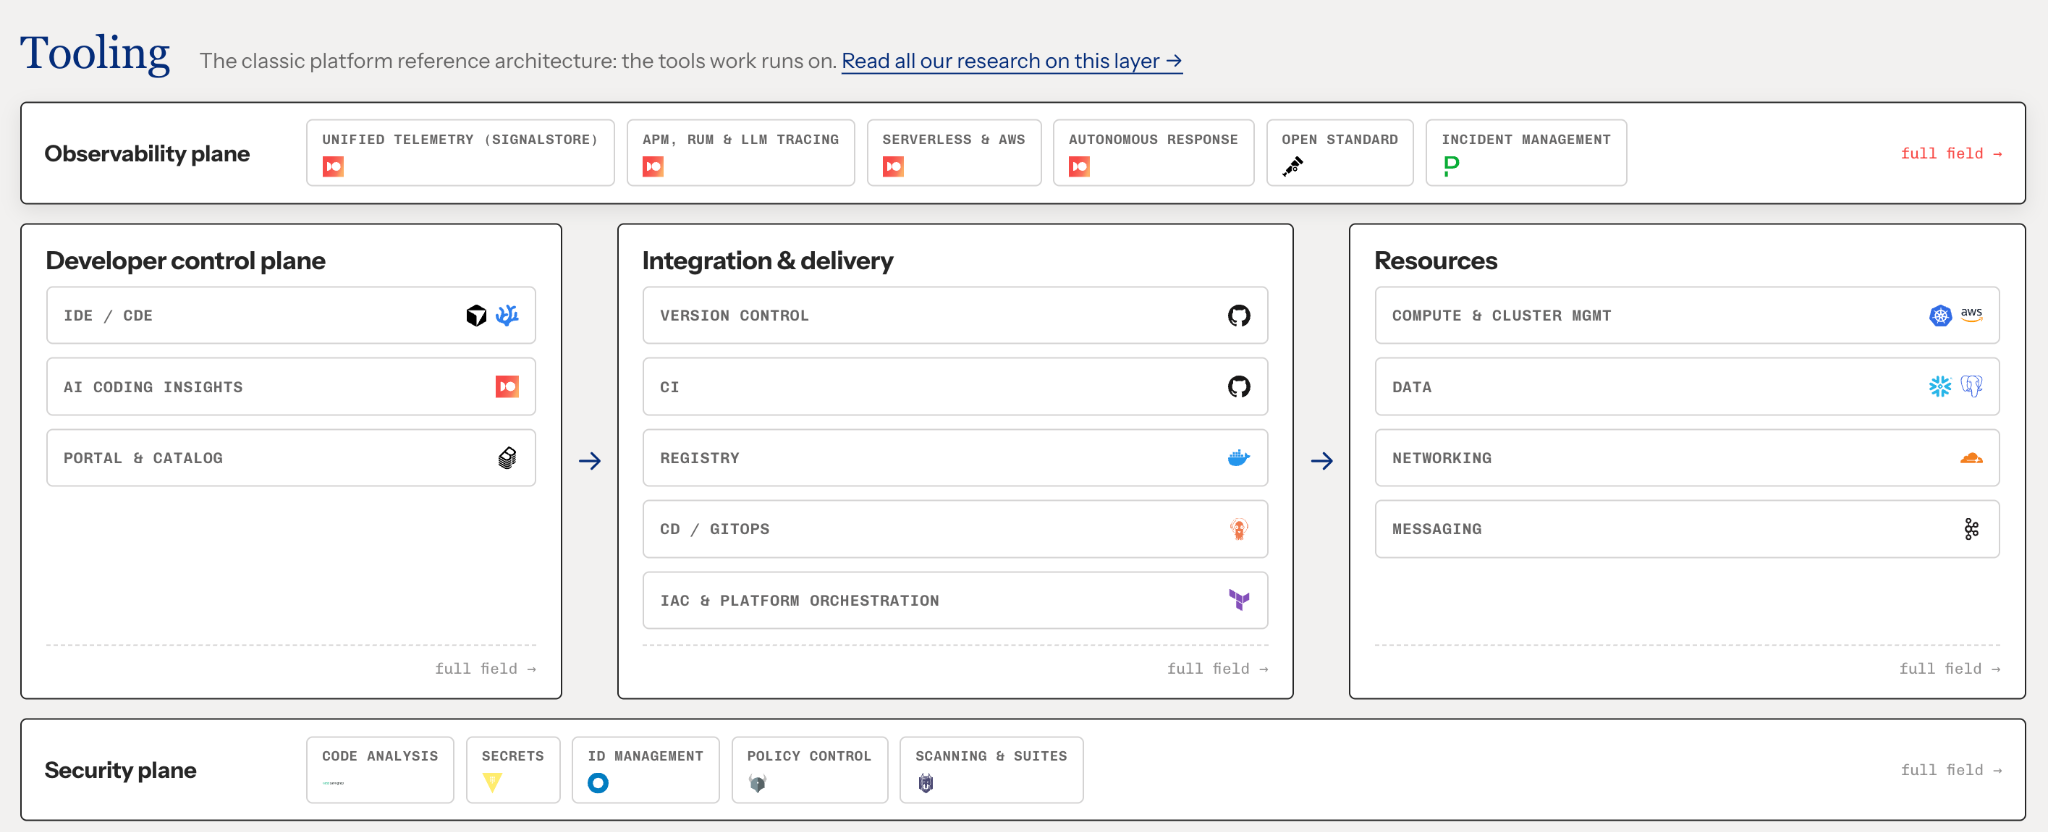
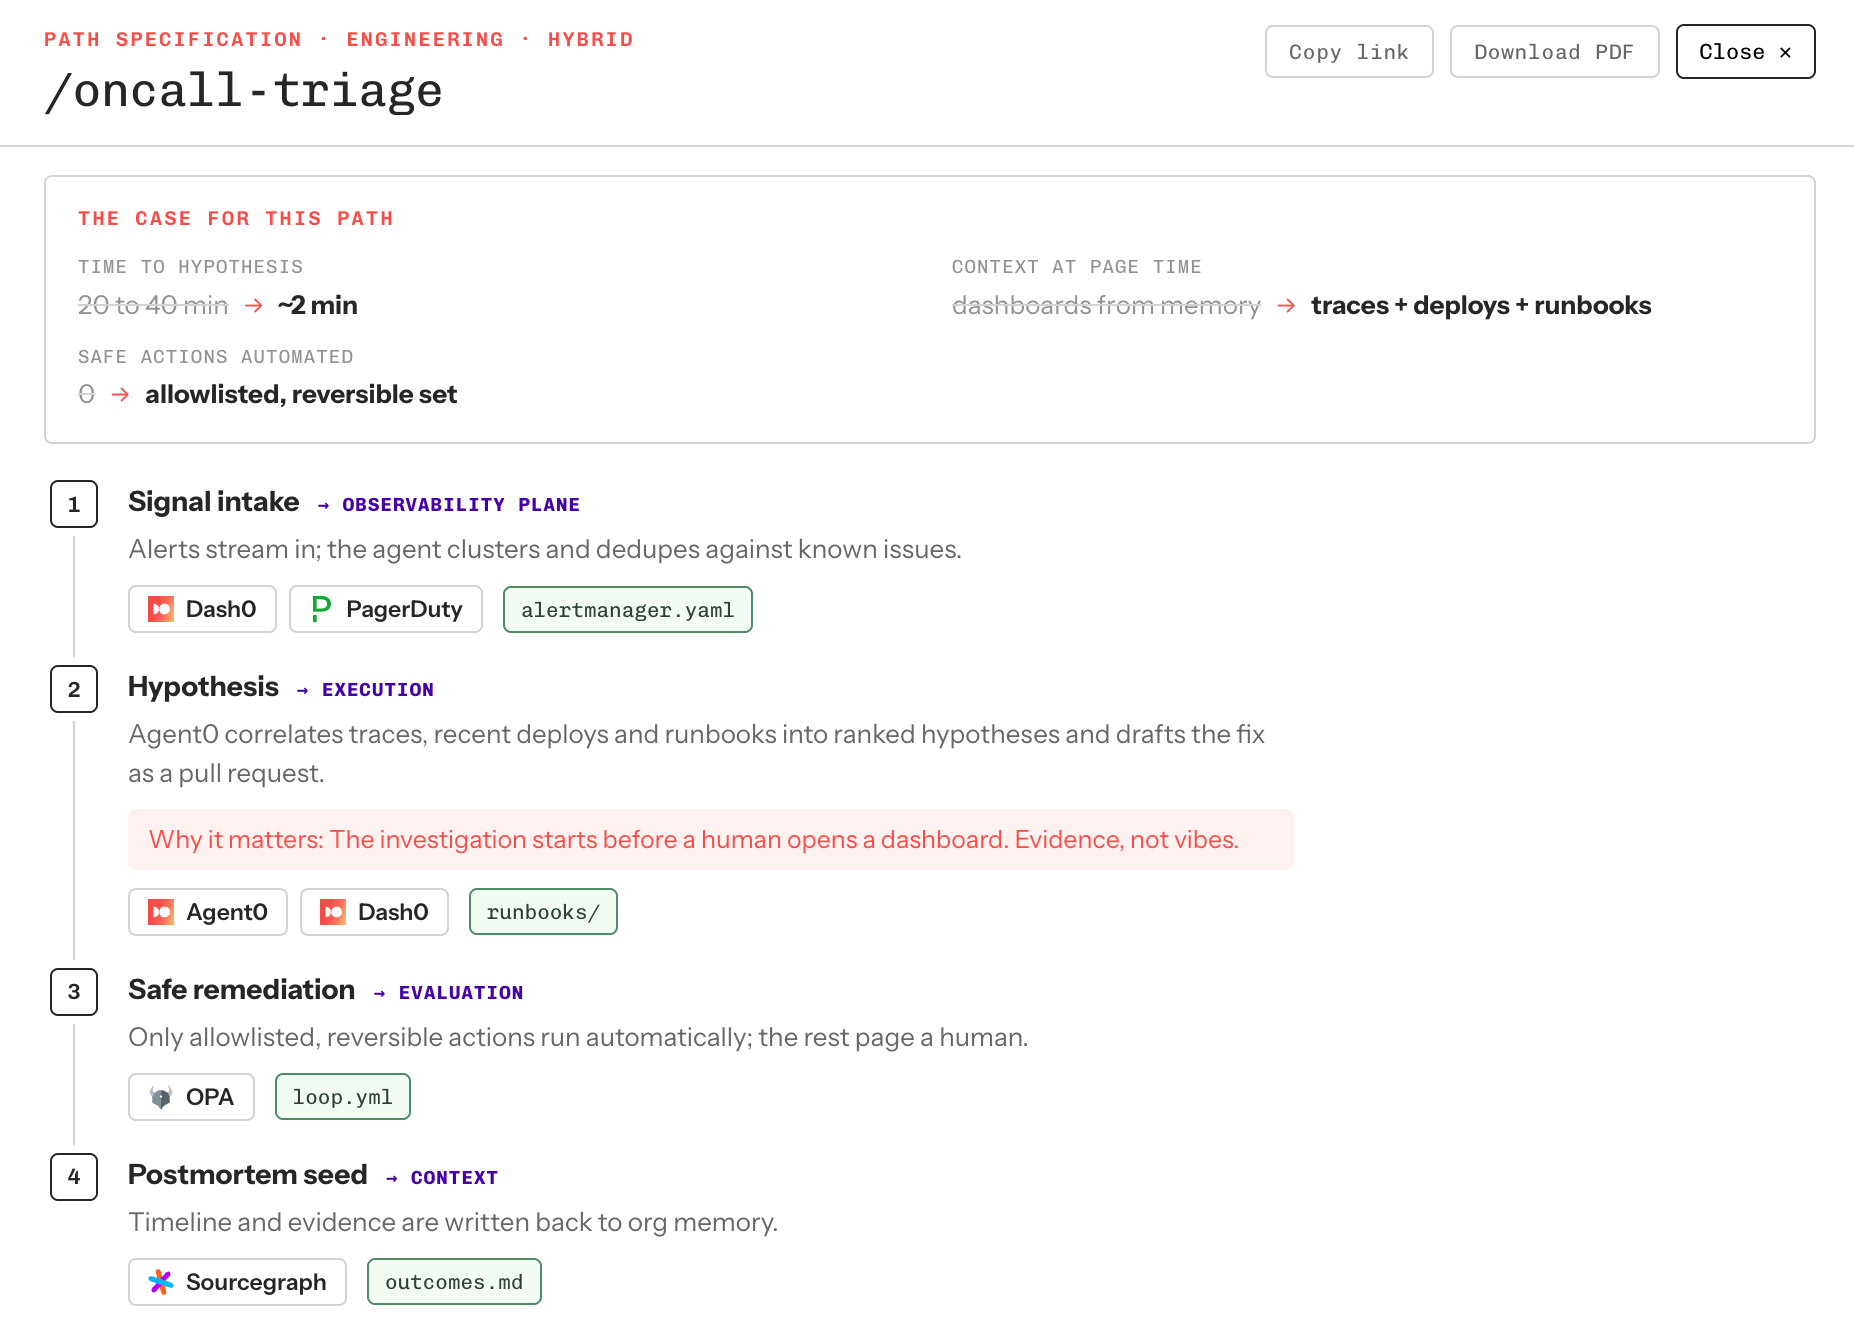
Take two paths. /deploy is deterministic: same input, same output, compiles to a pipeline, never needs an agent, and stays on the tooling layer at every maturity level. /oncall-triage is hybrid: the agent proposes a cause and a fix, a deterministic gate verifies it, and the loop runs until the gate passes or the budget is spent. The first path is just inside the IDP you already have. The second is what the IDP becomes when it has a second user and we call it the Agentic Engineering Platform: the IDP extended downward by an agent infrastructure layer and outward by paths an agent can invoke. It replaces nothing above it.
Where are most teams today? 49% use no AI at all for day-2 observability. 16% use LLMs or coding assistants to query observability APIs. 13% are building their own AI SRE on open-source frameworks. The 16% is the endpoint crowd, they have the access but not the reach yet.
Two tests, one intersection
When a committee sits down to pick the tracing backend, I would run two tests.
The first is whether the instrumentation work you do improves your own posture or the vendor's. With proprietary agents, every attribute you add is work you lose the day you switch. With an OpenTelemetry-native backend, it is yours to keep.
The second is whether the vendor's AI is an endpoint an agent can query, or an agent that reaches into cluster, code and cloud and acts through paths. It is the previous section's distinction, applied to a purchase.
Two tests give you several outcomes:
- Proprietary plus agent: the agent is real and mature, and your instrumentation works for the vendor.
- OpenTelemetry-native plus endpoint: your data is yours, and the AI is a chat window over it. Neither: a log estate that hasn't started either journey. Both: a small intersection.
Five questions to take into the vendor call that might make sense:
- Is it OpenTelemetry-native, so the instrumentation work stays yours?
- Is there one store that humans and agents query the same way?
- Is sampling decided in your environment, before egress?
- Does the agent reach beyond the observability tool into cluster, code and cloud?
- Does it show which agent wrote which change, and what that change did in production?
Think tracing first. Not because the tooling got better, but because the platform got a second user.