How to track DORA metrics with Logilica & Humanitec
The ultimate goal of DevOps is to make product development as smooth as possible. This doesn’t just benefit the organization, allowing for teams to meet their full potential, but it also improves developer experience by removing frustrating roadblocks. By helping developers to iterate faster, our engineering teams become more agile which, ideally, leads to higher customer satisfaction.
To fully understand how well the development pipeline works, organizations need to build processes to track key insights like DORA (DevOps Research and Assessment) metrics. However, it’s not enough to have that data available. Organizations need to be able to understand the context behind those metrics to truly decipher where roadblocks exist and risks are being introduced.
In February 2022, we were joined by Dr. Ralf Huuck, Founder and CEO at Logilica, and Nils Balkow-Tychsen, Lead QA Engineer at Humanitec, to learn how organizations can combine the Humanitec Internal Developer Platform, or IDP, with Logilica’s engineering analytics platform to provide those insights.
Managing product delivery

Every software company needs to create its product and deliver it to the customer as fast but also reliable as possible, which means that organizations need to pay attention to the product progresses through each step in the development pipeline. All of these steps need to function in a well-coordinated way because they all depend on each other. Ralf explains:
“You spend different amounts of time in different stages. The coding side is much longer overall than the build side, but if the build server falls over every second or third deployment, you’re in trouble and your timeline predictions go out the window. You need things to be fast and reliable.”
By improving speed and reliability, engineers can iterate faster and respond quickly to customer requests and bug fixes.
An additional bonus is that, when the development pipeline is fast and reliable, it has a positive impact on team happiness. This affects more than just an organization’s software developers, however. By ensuring the pipeline is well-coordinated, organizations improve the working experience of every engineer involved with the project, whether they’re working in development, testing, operations, or security.
Understanding how to optimize the development process requires organizations to not only track engineering metrics, but also understand what they’re revealing about what processes work well and what areas need improvement.
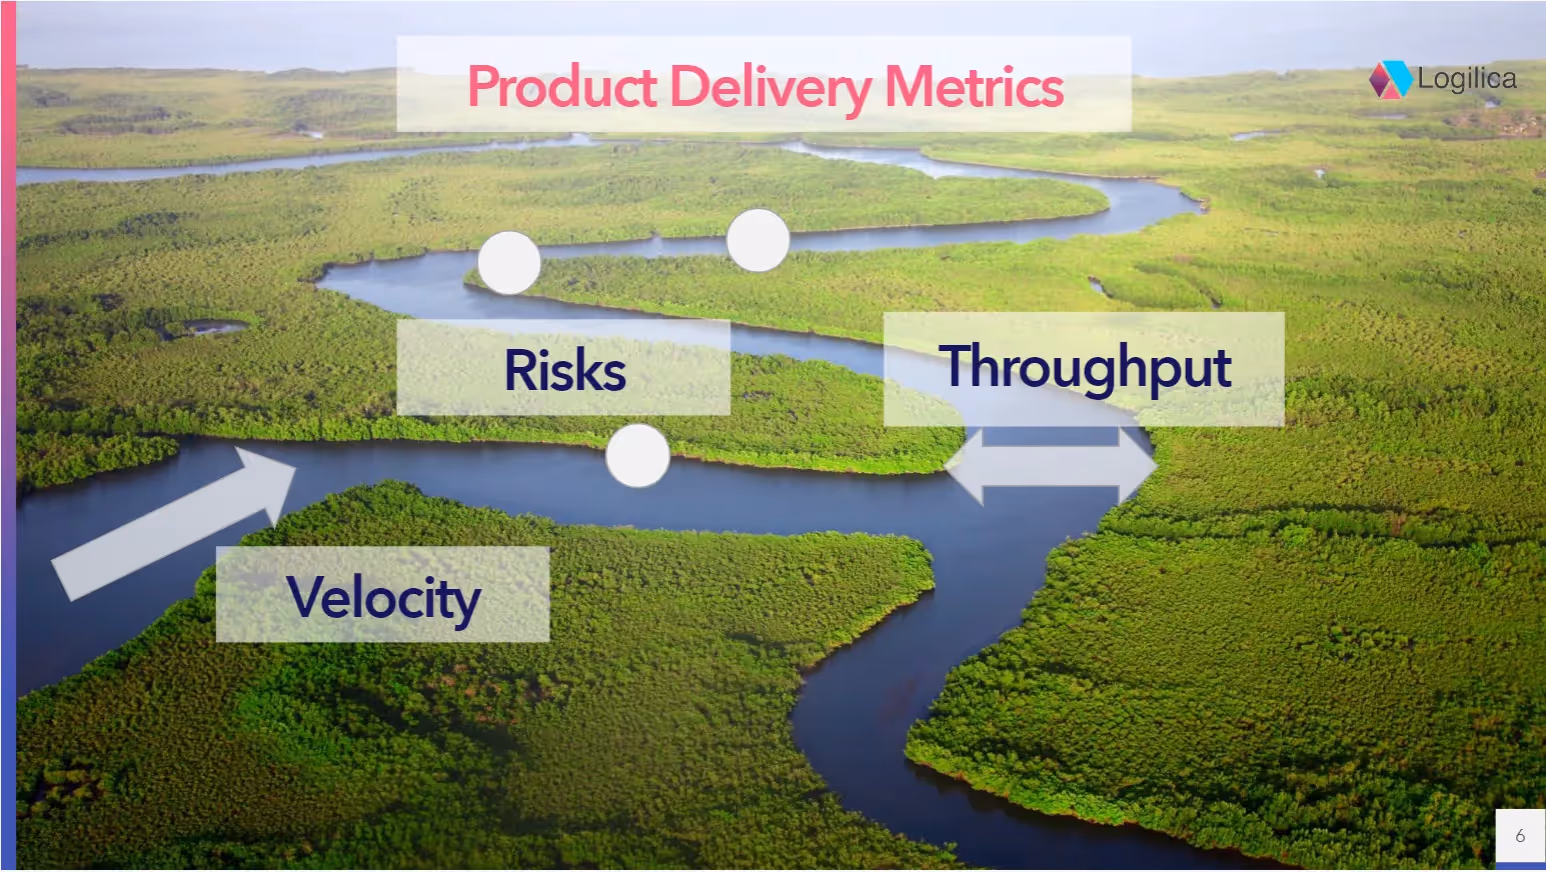
There are three key areas that metrics need to cover, says Ralf:
“We like to have this flow view to help us understand velocity, or how fast we’re moving, and our throughput, or how much capacity we have to deliver. Then there are the risks around the process where we might fall over or something unforeseen happens. There’s risk in infrastructure, team composition, or burnout if we’re asking teams to deliver too much in velocity or throughput.”

Velocity means different things to different people. For example, velocity for software engineers is the pull request cycle time. However, security teams may understand velocity as how long it takes to complete a security scan. Similarly, if an organization uses JIRA tickets, velocity may be measured by how long it takes between a ticket being created and when it’s closed, which will also depend on whether you close tickets as soon as the coding’s done, or once the code has been deployed. Engineering teams can also measure velocity as the end-to-end lead time on fixing bugs or adding new features.
Focusing on the example of velocity for pull requests, it’s clear that each stage also has its own velocity that can be tracked. Typically, software development can be broken down into four main stages - development, response, review, and integration. On top of measuring how long each stage takes to complete, organizations can also track the end-to-end velocity of the whole cycle. This gives them five metrics - how long each stage takes, plus the overall cycle length - that cover pull request velocity alone.
While this might sound excessive, looking at each stage as part of the whole can demonstrate where roadblocks and bottlenecks exist. Ralf elaborates:
“If your development time is too long, then the feature might be too large or the developer might not have the specifications they need from the product owner. You might have a problem with code review response time if no one’s available to review code, or again, features are too large and reviewers have to wait until they have a block of time available. And, with integration, that can be slowed down if things are too complex, there are QA issues, or if there are merge conflicts.”

Understanding throughput follows a similar methodology. The slide above shows an ideal throughput flow, with the vast majority of requests going through the full review and approval process before they’re closed. However, engineering rarely runs so smoothly, which leads to a more realistic view of throughput as shown in the slide below.
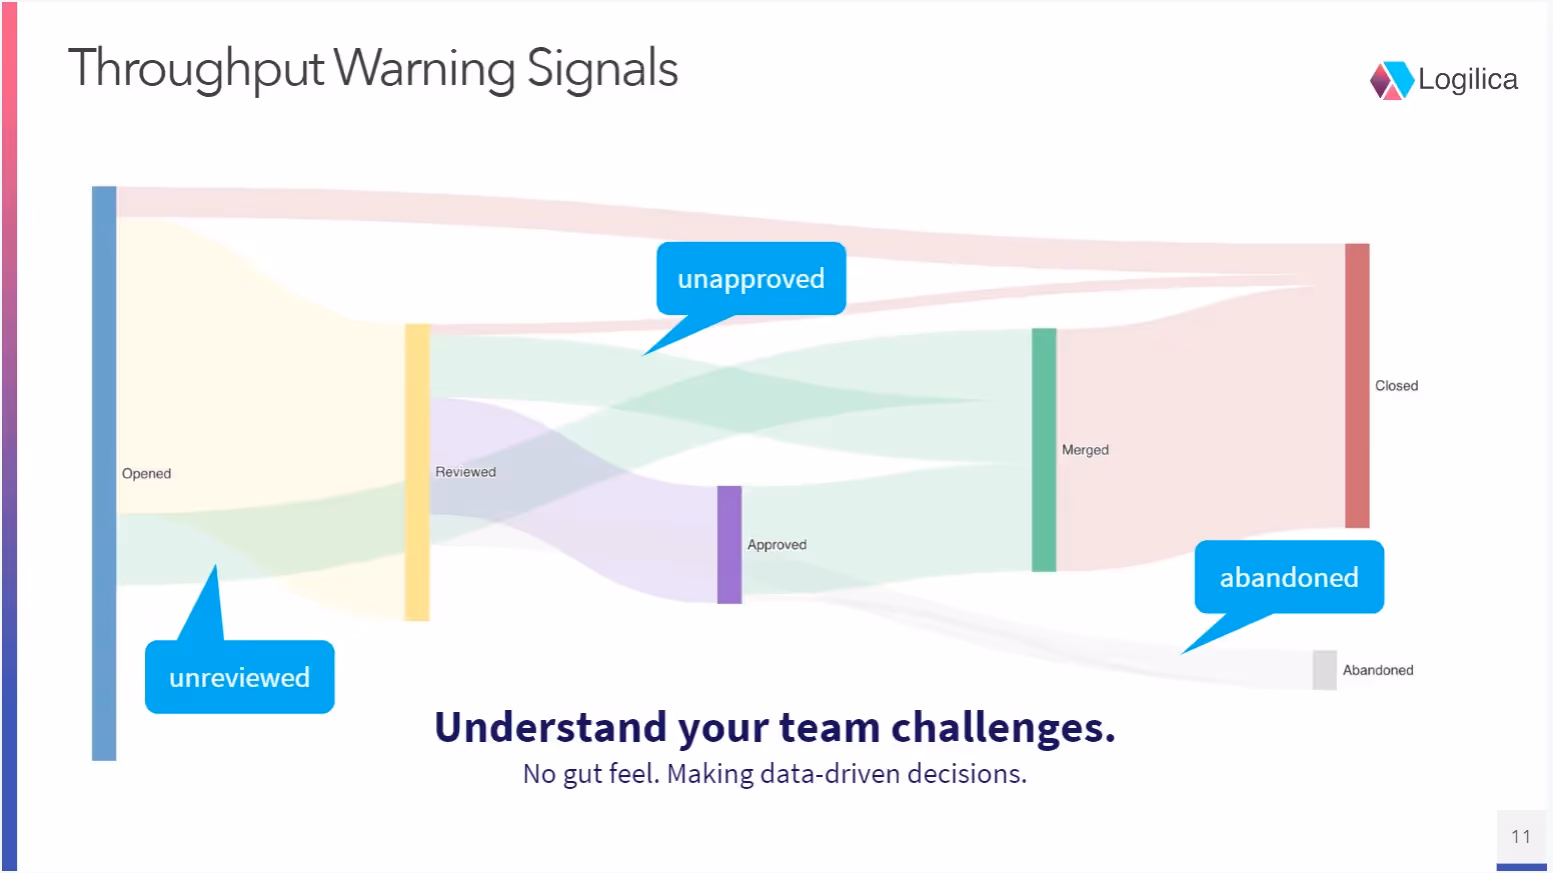
One vital thing to note with these throughput warning signals is that depending on the metrics the organization tracks and how those metrics are managed, they may do more harm than good. Ralf says:
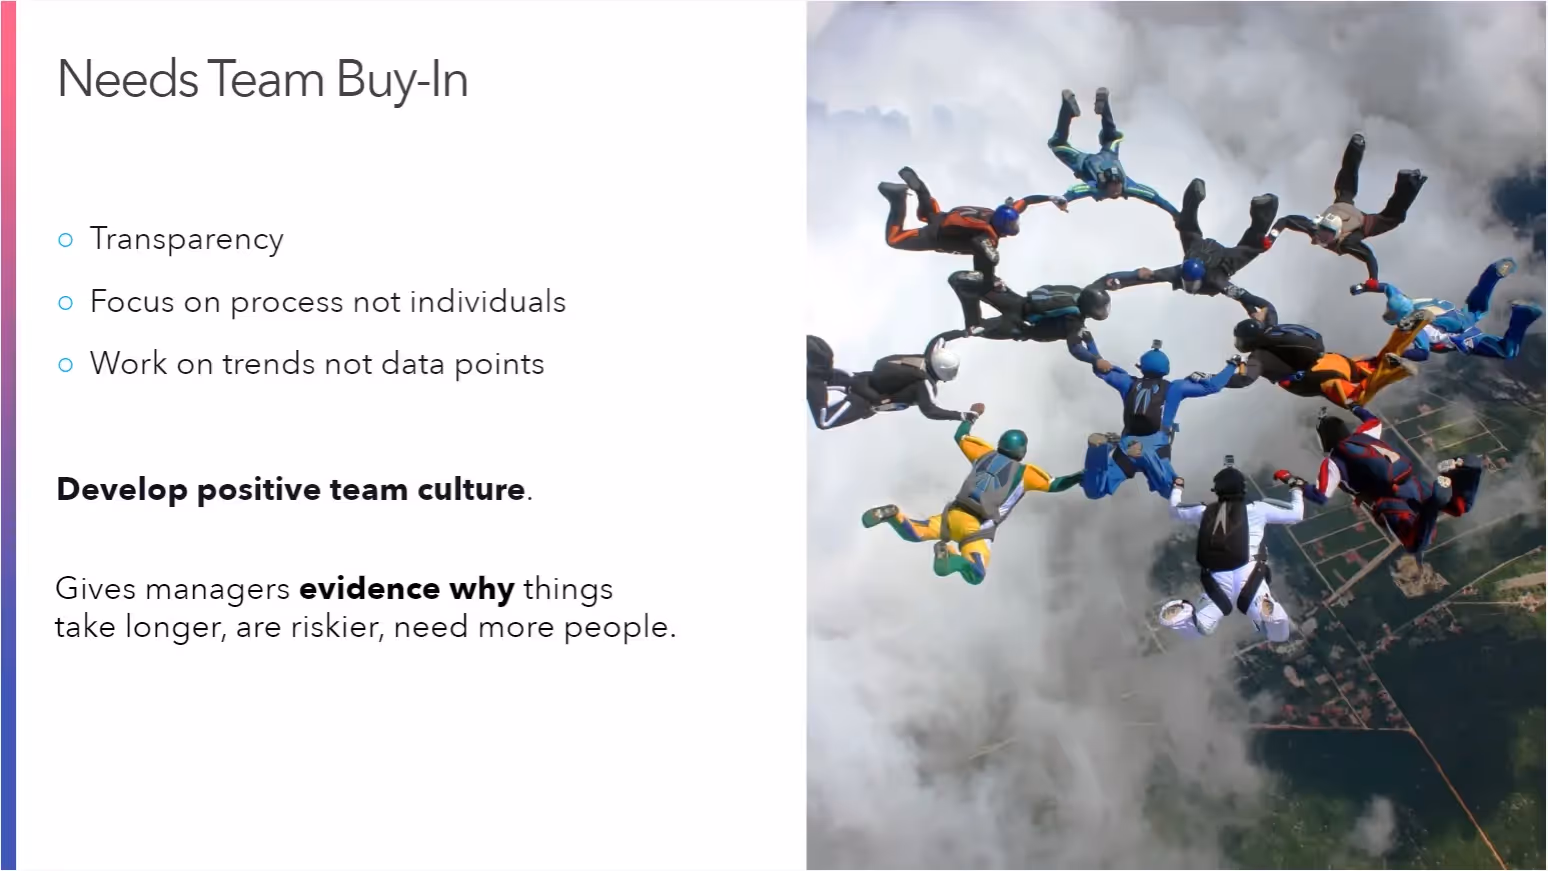
“Sometimes, things get opened and merged without being reviewed. If you’re focusing too much on review time as your velocity metric, this can lead to engineers to gamify it and say “Well, okay, I just won’t review this then.” It’s a team culture and transparency thing. We need to use metrics in the agreed fashion, not to micromanage people.”
In short, metrics need to be used to understand problems in the development pipeline, not as an indicator of an engineer’s job performance.
DevOps and DORA metrics
So, what metrics should organizations track?

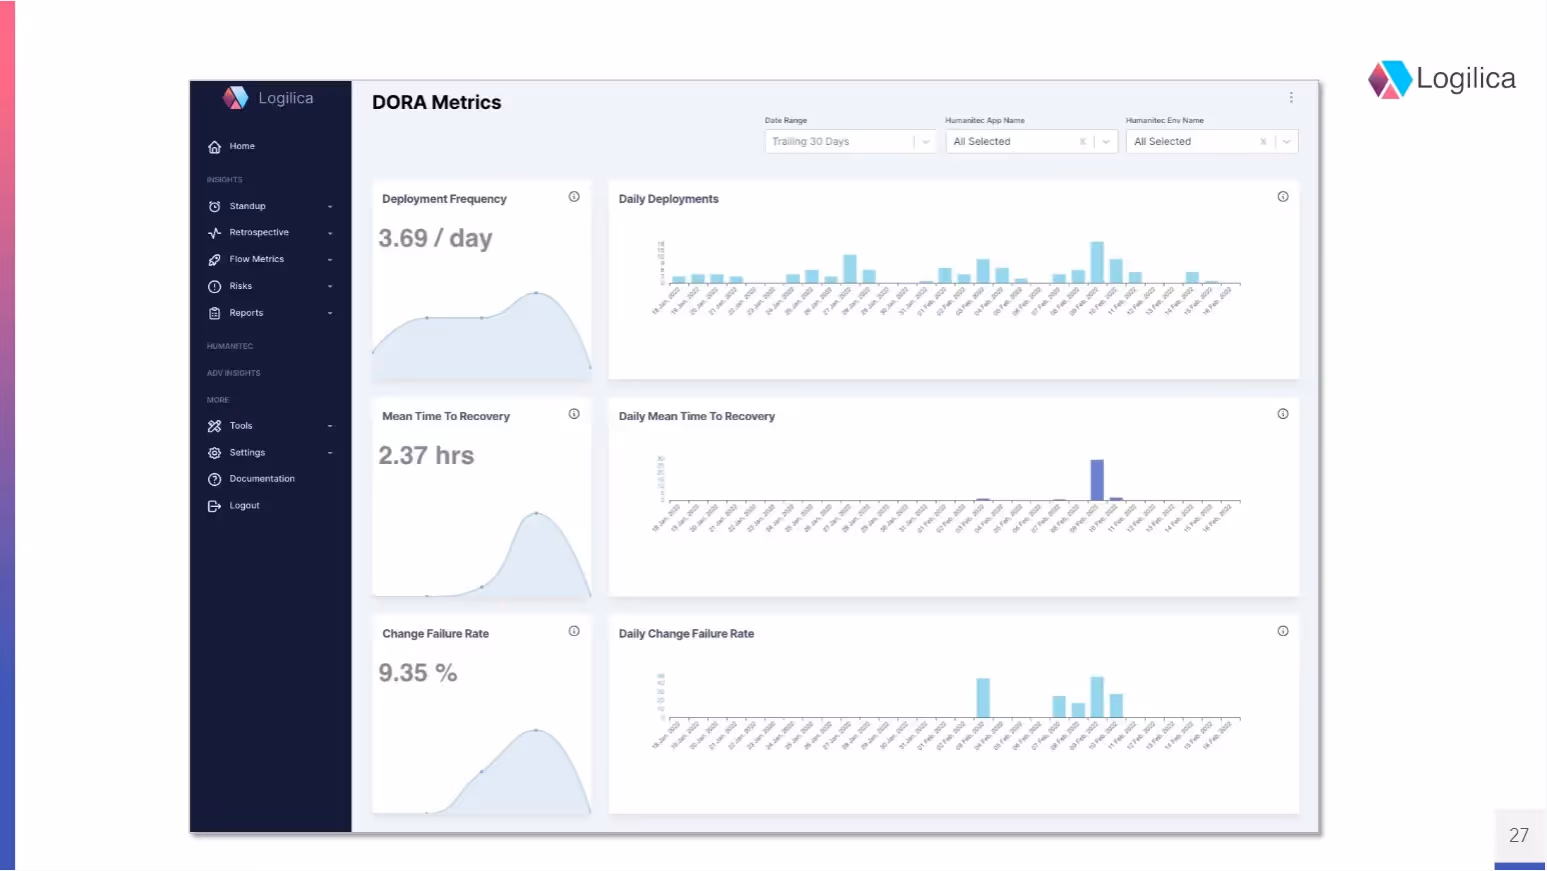
DevOps Research and Assessment, or DORA, is a research team at Google. In 2020, they launched their Four Keys open-source project, which helps organizations to measure and improve upon the efficiency and effectiveness of their engineering teams by using four key measures. These are:
- Deployment Frequency, or how many times a day code is deployed to production,
- Lead Time for Change, or how many hours it takes from starting an activity (like resolving a JIRA ticket) to production,
- Time to Restore Service, or how many hours it takes to recover from a production failure,
- Change Failure Rate, or how many deployments go wrong in production.
In addition to these metrics, Google also outlines what each metric should look like in a healthy development pipeline, as demonstrated by the yellow boxes in the slide above.
With that being said, Ralf cautions to see those outlines as yardsticks rather than definitive goals:
“This goes back to the colors I applied to each cycle in the pull request example. If everything was represented as yellow, that would be impressive for a lot of organizations. But metrics can be misused if we focus too much on that. People start asking “Why are you yellow, it should be green, how can you improve?” so we can’t take these thresholds at face value. It’s a good yardstick, but it’s not the golden rule that can’t be broken.”
Tracking metrics with data-driven engineering management
Once again, it’s important that tracking and analyzing metrics doesn’t get in the way of the engineering teams’ daily workflow. It’s helpful to visualize a tracking method as a radar system that looks out into what the organization is doing, receives that incoming information, and makes it available for analysis without needing much manual intervention.
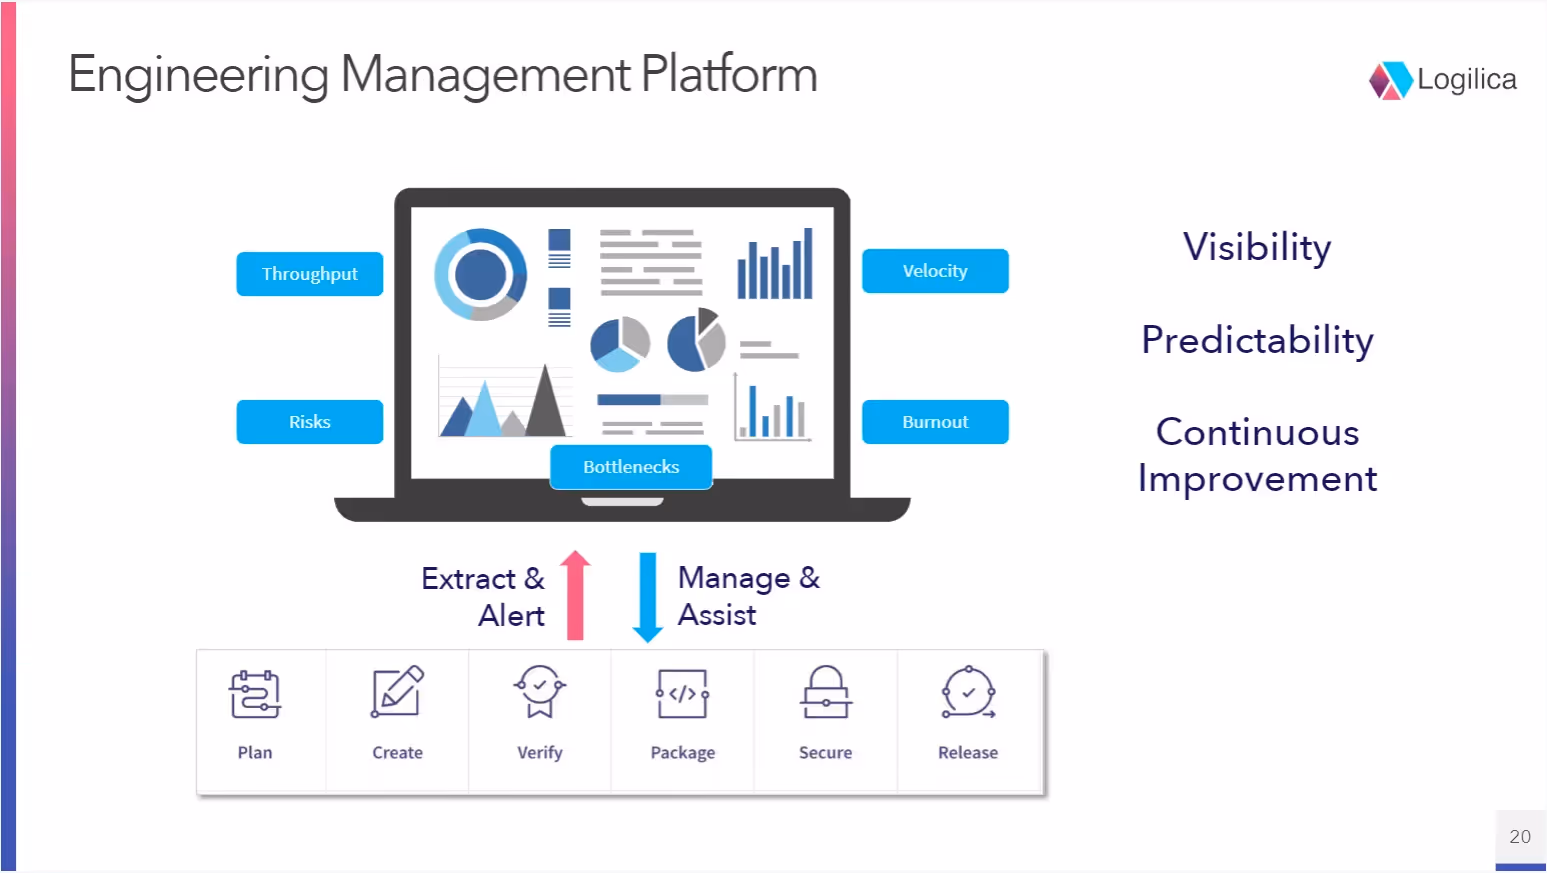
The best way of doing this is with an engineering management platform that gathers data, correlates it, and puts it into a dashboard management view that allows engineers to quickly see how the organization is performing. By automating data collection and tracking in this way, organizations can abstract that data away from the engineers who don’t need to use those metrics in their daily workflow.
This makes the process of collecting and aggregating metrics far less intrusive and more engineering-focused.
Organizations can build simple data tracking systems into their development pipelines, particularly as most modern tools already have APIs to track data, or that functionality can be enabled with scripts. However, particularly in large organizations, this DIY solution isn’t always appropriate. Ralf explains:
“If you need something more than simple, a platform will help you. If you have a lot of APIs and a large tool chain, having a platform will mean you don’t need to script everything and duct tape things together to get them to work for a few months. This gets replicated from company to company, which means spending a lot of time developing something from scratch that ideally should be more out of the box.”
Organizations don’t have to reinvent the wheel with their internal platforms. By building an Internal Developer Platform (IDP) with Humanitec, organizations can connect their engineering tools, APIs, and processes with an engineering analytics platform like Logilica to automate the collection and collation of engineering metrics.
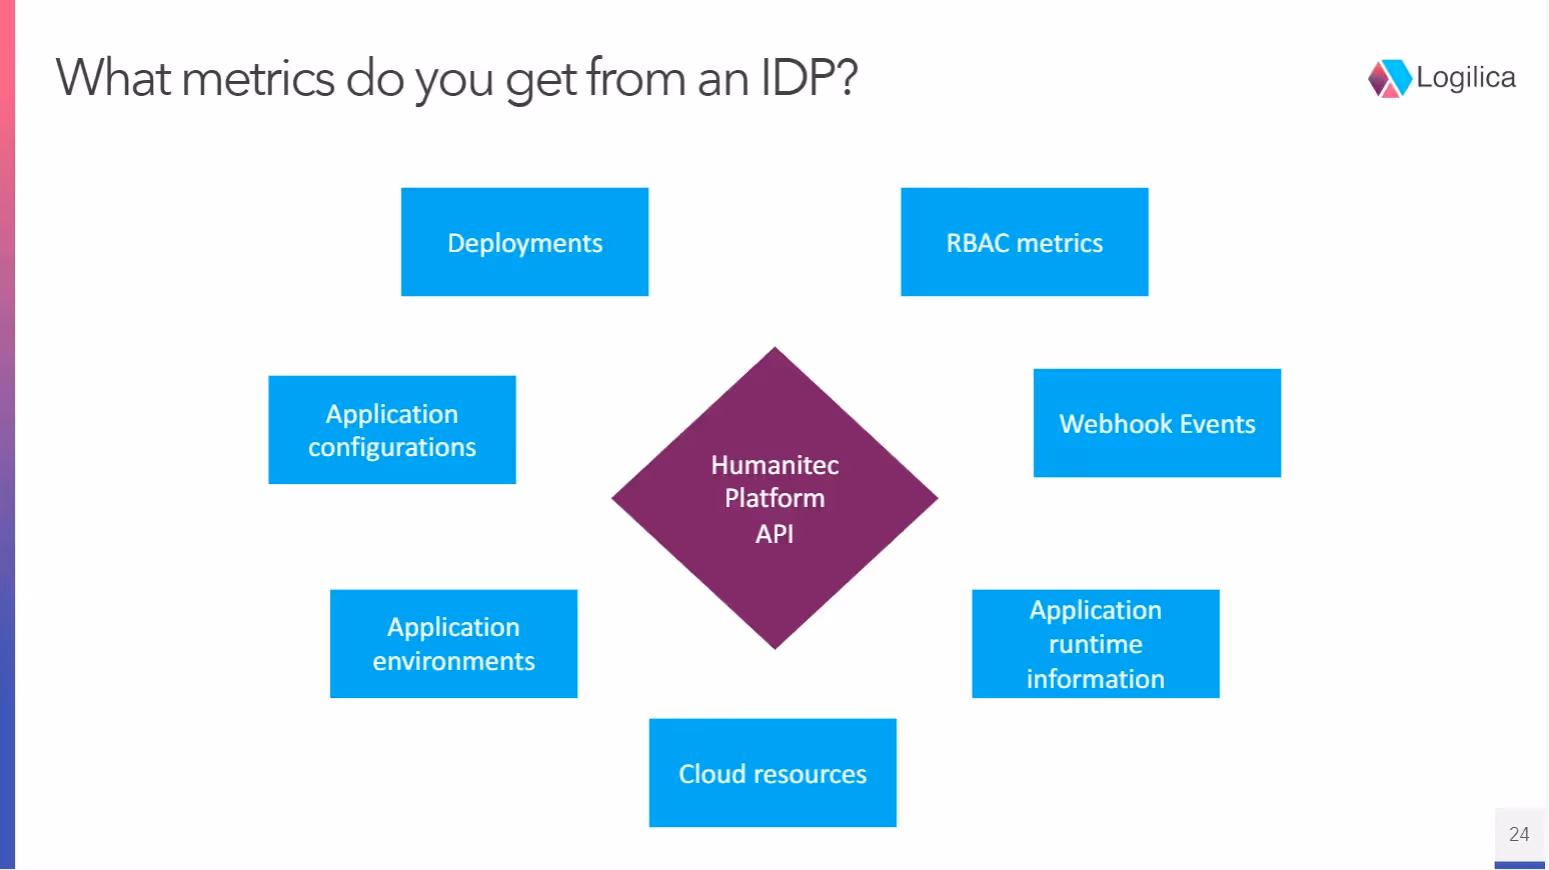
Nils, the lead QA engineer at Humanitec, explained how the Humanitec Internal Developer Platform (IDP) can be used in combination with Logilica to measure and aggregate DORA metrics:
“It’s interesting to see what metrics you can get from an IDP. We can see data about all of our deployments, including how often deployments fail. We can see how often application configurations change and whether certain backend services are updated more often than others. Metrics can also be used to cover application environments, CI/CD, cloud resources and how they’re consumed, and application runtime performance. You can even connect events to webhooks so that when those events happen, they can send that information to other APIs, allowing that data to directly integrate with other tools.”
This also allows organizations to understand where failures are happening and whether there’s a correlation between failures and infrastructure, tools, or services.
Lessons learned and future trends
One of the most common problems with DORA metrics is that these metrics are loved by an organization’s executives, but those metrics need to be contextualized. Only with context do those numbers become truly insightful, understandable, and actionable. There’s often a good reason behind why certain areas of engineering need improvement, and only by presenting the context behind those metrics can those improvements be communicated.
Similarly, organizations need to build a culture of transparency to have that context. Ralf adds, “Teams often say things like “We’ve told you before, the bottleneck is because we don’t have enough people to review the code”. Teams need to give a reason why things are the way they are.”
Moving into the future, combining an IDP with an engineering analytics platform like Logilica can give organizations greater insight into hidden correlations. For example, there may be certain correlations that are specific to a team or working style that is hard to decipher without AI-driven insights. By using AI to power intelligent alerts, organizations can build an internal platform that can warn engineers about learned anomalies detected during previous events.
As IDPs become more common in engineering teams across the globe, learning how to empower data collection and analysis by connecting an engineering analysis platform will be a vital part of keeping teams happy, efficient, and productive.
Thanks once again to Dr. Ralf Huuck and Nils Balkow-Tychsen for their insights into DORA metrics, engineering data analysis, and using an IDP to provide additional insights into those metrics. If you didn’t get a chance to catch the meetup, make sure to watch the recording here.
If you want to dive deeper into DevOps metrics, chek also Humanitec’s Benchmarking Study with data on the performance of more than 1,800 teams that took part in the survey.