


Executive summary
Platform engineering is no longer an optional enabler; it is a fundamental requirement. It has become a strategic capability for enterprises operating at scale. Yet many organizations struggle to articulate their value in financial terms. There have been multiple attempts in the past to look at the ROI of the investments across a tool stack. We have also seen published models, such as the Platform Value Model, which works well in organizations that have adopted platform engineering. To address the need for determining whether an organization will realize ROI with platform engineering, the Platformetrics ROI Model provides an actionable, transparent, data-driven framework for measuring the return on investment in platform engineering.
By combining practical business inputs, explicit benefit formulas, and the seven-plane architecture from Effective Platform Engineering [1], the model translates engineering improvements into financial outcomes. It demonstrates how reductions in toil, AI augmentation, and faster release cadences compound into tangible net value and measurable ROI. Remember that these are not limited to cost control measures; instead, they extend their benefits towards unlocking new revenue potentials.
ROI models
Understanding the return on investment in Platform Engineering requires looking at multiple perspectives. Foundational ROI examines the value gained from investing in the platform itself, whereas Product ROI focuses on the benefits of incorporating specific tools into the platform's journey. Attributional ROI examines the impact of applying AI or automation to platform operations. Two other essential models—Strategic ROI and Developer Experience (DevEx) ROI—also exist. Still, because they depend on the insights generated by the first three, they are beyond the scope of this discussion.
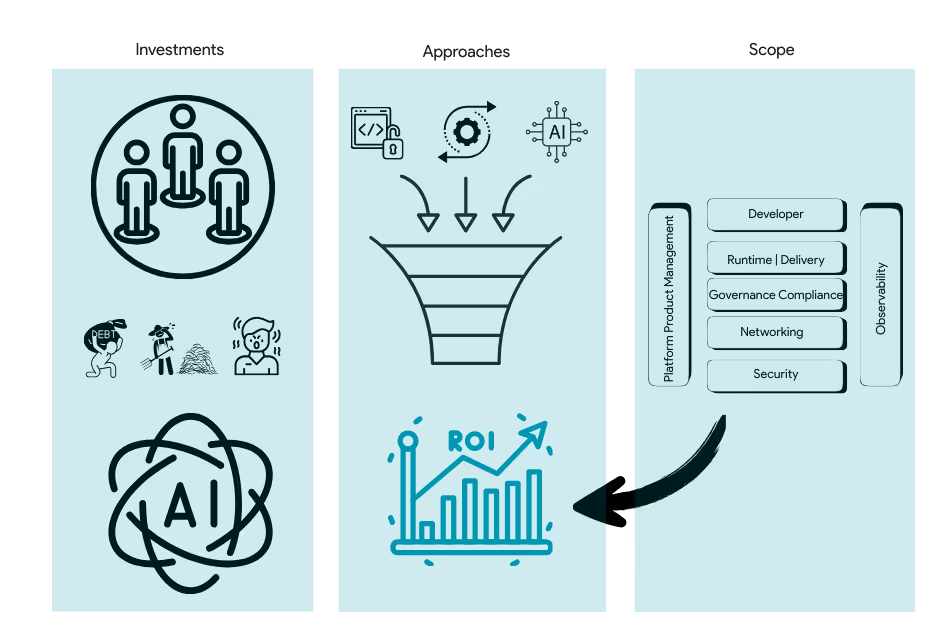
In Figure 1 below, we have a contextual view of various ROI models. Each layer in the diagram addresses a distinct problem for a specific set of stakeholders.

Before discussing the foundational ROI model presented in this paper, it is essential to examine the existing frameworks for product ROI and attributional ROI layers shown in Figure 1.
Product ROI models are most commonly advanced by tool vendors who need to demonstrate the tangible value of their offerings. For example, Humanitec[3] provides a straightforward yet effective ROI model for its platform orchestrator, typically focusing on reduced lead times for environment provisioning, lower cognitive load for developers, and cost savings from standardization. Vendors like Mia-Platform[9] have taken a broader approach to provide you with all the considerations you should consider when thinking about the ROI.
Similarly, Jellyfish[4] offers a comprehensive ROI calculator for its SEI platform (also known as the Engineering Management Platform), demonstrating how engineering resource allocation is directly tied to business outcomes, such as the faster delivery of revenue-generating features. Other vendors, such as LinearB [11], offer calculators focused on “developer efficiency,” showcasing metrics like cycle time improvements and engineering throughput gains from adopting their workflow analytics. Products such as Pluralsight Flow[12] and Code Climate Velocity[13] position their ROI claims around improved visibility for engineering leadership, linking productivity insights to faster delivery and higher-quality outcomes.
The attributional ROI layer takes it a step further by linking specific interventions to measurable outcomes. Faros AI [5], for example, provides attributional ROI measures for GitHub Copilot usage, quantifying how AI-assisted coding reduces development effort by calculating the percentage of code written with AI assistance and translating it into saved engineering hours. Swarmia[14] discusses some of the challenges associated with calculating this attributional ROI. Similarly, companies like Tabnine [15] or Replit [16] are now experimenting with ROI frameworks for AI-assisted development, measuring the impact of autocomplete and boilerplate generation on developer velocity. Vendors like GetDX[6] bring depth by conducting structured research studies, correlating platform and DevEx improvements with productivity gains and employee retention, thereby attributing ROI to cultural and operational dimensions rather than just tooling. Beyond AI, vendors such as Harness [17] or GitLab [18] also provide attributional ROI calculators that model the direct savings from reduced CI/CD pipeline failures, deployment rollbacks, or shortened mean time to recovery (MTTR). These attributional models are powerful because they help leaders connect specific platform interventions, such as automated testing, observability, or incident reduction, with downstream business value in a measurable way.
It is within the context of attributional and product ROI, which we discussed above, that we need to think about the Foundational ROI. We have seen several foundational models over the years, both in generic measurement models and vendor-driven models. Our preferred approach is the PVM, or Platform Value Model [2], which allows you to track specific investments tied to particular features and determine ways to model not only the breakeven point for your investments but also to assess whether these investments are indeed worthwhile. As technical product managers and platform engineering decision-makers, this model helps you determine what to work on and when.
Our goal at Platformetrics[19] is to act as a vendor-agnostic player in this space and examine the foundational ROI layer of your platform engineering journey. This enables us to determine whether you should embark on the journey and, if you do, which tool stacks will provide the maximum bang for your buck.
The model we introduce does not negate the need for either the vendor-specific ROI models or attributional ROI models, but instead complements and sits at a more foundational level before you decide on either. Ideally, this model should be used as part of your as-is baseline assessment, providing clarity on your current state before making significant investments in tools.
Taking this foundational approach has several advantages:
- Vendor-agnostic clarity: Rather than being influenced by a vendor’s ROI narrative, you start with a neutral baseline of your current productivity, toil, and opportunity gaps. This avoids over-investing in tools that may not align with your real needs.
- Holistic perspective: Foundational ROI examines all aspects, such as productivity, efficiency, reliability, compliance, and developer experience, ensuring the business case is not skewed toward a single metric, such as cost savings.
- Future-proofing: By modeling ROI before adopting tools across the ecosystem, you can evaluate how today’s investments will scale with future AI, automation, and developer experience trends. This prevents lock-in and enables tool substitution down the line.
- Prioritization: A foundational ROI baseline enables you to identify which improvements, such as reducing deployment toil (mind-numbing busywork you want your developers to avoid), enhancing onboarding (how fast your want your developers to be fully productive members of the team once they are hired), and automating compliance (avoiding the need for developers to understand all the regulatory requirements needed for complying with the industry requirements to be successful in your product delivery), will yield the most significant returns, allowing you to prioritize initiatives effectively rather than spreading your investment too thin.
- Stakeholder alignment: The model provides a shared language for engineering leaders, finance, and business stakeholders—sometimes even including external clients—to align on expected value. This reduces friction when justifying budget and accelerates executive buy-in.
- Comparability: Since the model is vendor-neutral, organizations can compare tool stacks side by side against the same baseline, ensuring that ROI claims are evaluated in the context of organizational realities, rather than in isolation.
- Measurable progression: Using a foundational baseline makes it easier to track improvements over time and attribute them to the right interventions, whether platform-driven, process-driven, or tool-driven.
In short, the foundational ROI model serves as your compass, helping you decide not only whether to invest in platform engineering but also where to focus first and which tools or practices to prioritize.
Inputs to the model
The ROI model begins with a set of inputs that describe your engineering organization. Remember that any ROI must first start with your returns and work backward to your investment. They should also be a mix of self-reported and system-generated data on both the qualitative and quantitative axes. If you cannot clearly define your returns, you will very rarely have a way to justify your investments.
Here is the key set of inputs we will consider:
Team size: Number of engineers included in the analysis. This is your target set of developers who will benefit from the improvement in the overall developer experience through platform engineering. Not all platform engineering needs are driven by DevEx, and it may be significantly tilted towards reducing operational costs or balancing costs across product scaling, which is to be expected. The team size number can represent a combination of these. The obvious danger here is to parse these with a fine-grained model, which will render it less effective.
Average salary: Base annual salary per engineer, multiplied by 1.3 to account for 30% benefits and overhead. This is by far the most straightforward metric to add. Most organizations these days have both contingent and non-contingent workers. That means you have to either find an average of the salary numbers or model them separately. In an earlier version of the model we had developed and published, we had considered both, but later found that it is easier to keep this as a fully loaded cost of an engineer, as opposed to an FTE.
Weekly toil hours: Average weekly hours per engineer lost to manual, repetitive tasks. This is a subjective metric to start with and can be improved over time. However, if you examine your engineering teams across the board, not just developers, you can arrive at more conservative numbers to start with. The reason to go conservative here is that these numbers start adding up, and saving the toil time is basically the return you are going to get. The last thing you want to do is to add to the toil, but measuring toil can get awfully complicated. Most of the SEI tools we mentioned earlier in this paper provide easy ways to quantify developer effort, either through a qualitative or quantitative approach.
Current AI usage: Baseline productivity uplift factor (none = 1.0, basic = 1.15, advanced = 1.35, expert = 1.5). The percentage uplift of 15, 35, or 50 is highly subjective in this context. However, this is also in line with the data being published by the industry in multiple sources, such as the now-popular METR study [20]. We have become even more conservative in our current AI usage. As an expert on LLMs and their application, going beyond what the tools provide will give you only a 50% advantage compared to the basic usage of 15%, which is both acceptable based on what we have seen. Remember that the purpose of ROIs is to develop a model that does not, in any way, overestimate the value compared to the investment. These numbers might change over time as we learn more.
Team AI readiness: Risk multiplier (low, intermediate, high, expert) applied to implementation cost. A risk multiplier reflecting how prepared your teams are to adopt and leverage AI effectively has to be part of the modeling. The spectrum ranges from low readiness (higher costs, longer ramp-up times, and heavier change-management overhead) to expert readiness (faster adoption, minimal friction, and lower costs). The purpose here is to temper ROI projections with the reality of your organization’s current AI maturity. Overestimating readiness almost always leads to inflated numbers that won’t withstand scrutiny, so it’s safer to be conservative until proven otherwise.
Deployment frequency: Monthly, weekly, or daily release cadence. A cadence metric for how often your teams push software into production: monthly, weekly, or daily. Based on the learnings from DORA, this is a strong leading indicator of both maturity and efficiency. Higher deployment frequency is correlated with faster feedback loops, reduced batch sizes, and ultimately higher business agility. Conversely, lower frequencies indicate more bottlenecks and higher coordination overhead. This metric provides a proxy for both velocity and the return potential of platform engineering improvements.
Industry: Regulatory multiplier (general = 1.0, financial = 1.3, healthcare = 1.4, startup = 0.8). Based on our prior experience, a regulatory multiplier is used to account for domain-specific compliance overheads. General industries carry a neutral weight (1.0), while financial services (1.3) and healthcare (1.4) reflect heavier compliance and governance burdens, which increase the cost of inefficiency but also amplify the value of improvements. Startups (0.8) are often more agile and less regulated, so the multiplier dampens expected ROI. Using this factor grounds the model in the realities of sector-level constraints, rather than assuming a uniform environment.
Technical debt level: Effort multiplier (low = 0.9, medium = 1.0, high = 1.3, very high = 1.6). An effort multiplier tied to the state of your codebase and architecture. A low debt ratio (0.9) means changes can be made relatively easily, whereas a very high debt ratio (1.6) suggests that nearly every improvement comes at a disproportionate cost and complexity. Unlike toil or salary, this is less straightforward to quantify, but most engineering leaders will recognize where their teams sit on the spectrum. Acknowledging technical debt keeps ROI honest by recognizing the drag it imposes on the velocity of change.
Analysis horizon
The analysis horizon defines the period of evaluation, typically spanning 1 to 5 years. A shorter horizon emphasizes quick wins but risks overlooking the compounding effect of efficiency gains. A longer horizon provides a more realistic view of cumulative impact, though it requires more assumptions.
In practice, most organizations align the analysis horizon with their strategic planning cycles (commonly 3 years), ensuring consistency and comparability across initiatives. According to the International Institute of Business Analysis (IIBA), selecting the right horizon depends on the analysis domain:
- Strategic — Long-term alignment with organizational vision and competitive positioning.
- Planning — Medium-term cycles (e.g., 2–3 years) that balance investment and delivery milestones.
- Delivery — Short-term focus (1 year or less) on validating immediate outcomes and MVP performance.
An MVP-specific model is currently under research; however, without careful handling, it can mislead by overstating near-term results or underestimating long-term value
In Figure 2, you can see a comprehensive view of how this model comes together in modern engineering organizations.
Now, let us examine the remaining components of this model in the subsequent sections.
Current state diagnostics
To start the work around calculating ROI, you need to first baseline the core metrics. There are four core metrics to consider. We believe they are:
- Total engineering cost
The total engineering cost is computed simply by multiplying the number of team sizes by their loaded salary (30% markup beyond the wage to make it loaded). This metric calculates the dollar value of engineering capacity wasted on manual operational tasks (toil). It's derived by taking the percentage of time spent on repetitive, manual work and multiplying it by the total loaded engineering cost. Using pseudocode to represent it can provide us with something along the following lines.
const currentProductivity = totalEngCost *
	   multipliers.currentAI[config.currentAI];
This represents the opportunity cost of having skilled engineers perform tasks that could be automated through platform engineering.
- Annual toil loss
Annual Toil loss is also reasonably straightforward, where you take the toil hours per week and calculate the percentage of the total hours in a week that this represents. This would then get multiplied by the annual loaded costs to get the yearly productivity loss. This metric calculates the dollar value of engineering capacity wasted on manual operational tasks (toil). It's derived by taking the percentage of time spent on repetitive, manual work and multiplying it by the total loaded engineering cost.
const toilLoss = (config.toilHours / 40) * totalEngCost;This represents the opportunity cost of having skilled engineers perform tasks that could be automated through platform engineering.
- AI opportunity
This percentage shows the potential productivity uplift available through adopting AI-native platform tools and workflows. It compares your current AI adoption level against the maximum possible AI multiplier (1.75x for AI-native platforms). The calculation reveals the potential additional value that could be unlocked through strategic AI integration.
			const aiOpportunity = Math.round(((1.75 -
			multipliers.currentAI[config.currentAI]) /
			multipliers.currentAI[config.currentAI]) * 100);
- Efficiency gap
This metric expresses the productivity loss as a percentage of total team capacity, highlighting what portion of your engineering investment is being consumed by non-value-adding activities. It provides a clear view of the improvement opportunity and helps justify platform engineering investments by showing the scale of current inefficiencies.
const efficiencyGap = Math.round((toilLoss / totalEngCost) * 100);
Platform investment options
As you start considering your investment options, the model compares three representative strategies. Based on our conversations with clients, there is a wide spectrum of needs, ranging from organizations that want to build everything in-house, using open-source solutions that incur no third-party licensing costs, to fully managed solutions. There is no solution out there today that will let you “buy” your way out of a platform engineering journey. For more reasons why that is so, we request you to check out our book[1] on this topic.
Strategy # 1: Open Source foundation
A platform approach built primarily on open-source components, offering the lowest upfront cost but demanding significant engineering capacity to operate and maintain. The appeal here is flexibility and vendor independence, but the trade-off is slower time-to-value due to the effort required to integrate, secure, and sustain the ecosystem. Many organizations underestimate the long-term support burden, particularly in areas such as patching, scaling, and compliance, which often neutralize the perceived cost savings. This model is best suited for organizations with in-depth in-house expertise and a willingness to invest in ongoing platform maintenance and support.
Strategy #2: AI-Enhanced Hybrid
A blended model that combines commercial tooling with open-source foundations, augmented by targeted AI capabilities. This approach strikes a balance: moderate licensing investments are offset by measurable productivity and operational improvements from AI-driven automation (e.g., reducing toil, improving incident response, accelerating deployments). The time-to-value is faster than that of pure open source, and the operational burden is more sustainable, although it still requires thoughtful integration. This option is attractive for organizations that want to gradually modernize while still leveraging existing investments, with AI providing a bridge between efficiency and innovation.
Strategy #3: AI-Native platform
A fully integrated, vendor-led platform approach where AI capabilities are not add-ons but are deeply embedded into the fabric of developer workflows and operational controls. This option incurs the highest licensing and subscription costs but also delivers the fastest time-to-value, the lowest maintenance overhead, and the most significant productivity gains. Note that this still incurs maintenance overhead and, at times, requires deeper training in the tool for your organization or retaining the services of systems integrators, who are likely the preferred partners of these vendors. In this model, AI reduces cognitive load across the board, from code generation to policy enforcement to cost optimization, making it the most transformative option. The trade-off is vendor dependence and potentially less flexibility. Still, for organizations seeking accelerated impact at scale, the AI-native path provides the most straightforward path to exponential returns.
The following table summarizes these strategies for easy reference.
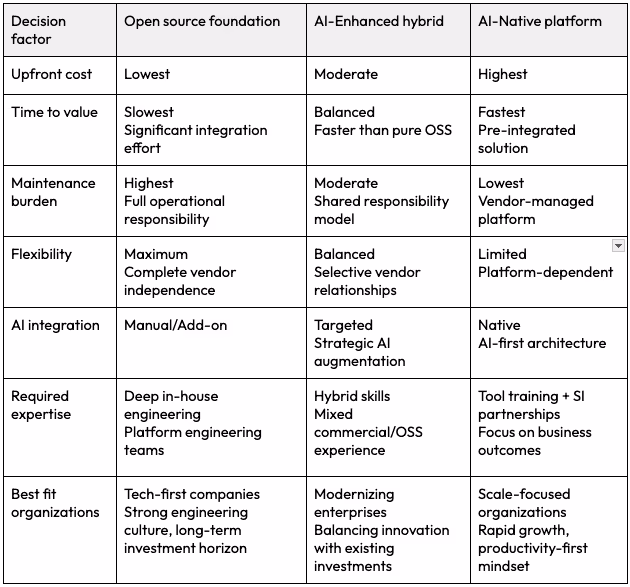
Now, let us assess each option against the exact five output dimensions.
Five output values explained
The model suggests five key output values.
- Implementation cost (one-time)
While an upfront investment is required to initiate your chosen platform approach, the broader trend reflects a shift from large, one-time capital expenditures toward more predictable operational expenditures — enabling organizations to scale capabilities incrementally, reduce risk, and align costs with ongoing value creation.
For example, an AI-enhanced hybrid platform might cost $180,000 in licensing, plus 12 weeks of implementation effort. With two platform engineers at $120,000 salaries working full-time, that's an additional $55,000 in labor costs. Risk multipliers increase this based on your context - a healthcare company with high technical debt and low AI readiness might see a 1.8 times multiplier, resulting in a total implementation cost of $423,000.
This covers tool setup, integration work, team training, and initial configuration.
- Annual benefits
The ongoing value is generated each year once your platform is operational.
Using a 25-person team example: toil reduction saves $390,000 annually (50% of the $780,000 productivity loss), AI productivity boost adds $1,560,000 in effectual output (40% improvement on $3.9M baseline), operational automation saves $468,000 in reduced incident response, and improved deployment frequency adds $337,500 in faster time-to-market value for a total annual benefits: $2,755,500.
- Annual costs
Recurring expenses to maintain your platform investment.
This includes ongoing licensing fees (typically 20% of initial license cost, so $36,000 for our $180,000 example) plus maintenance effort. An AI-enhanced hybrid platform requires 0.4 FTE of ongoing maintenance, costing $62,400 annually (40% of a $156,000 loaded salary), with a total annual cost of $98,400.
- Time to value
How long before you see full benefits from your investment?
Open-source platforms typically require 12 months due to the extensive custom development and integration work involved. AI-enhanced hybrid platforms reach full value in 9 months, with some pre-built components, but customization is still required. AI-Native platforms achieve benefits in just 6 months thanks to intelligent automation and self-configuring capabilities that minimize manual setup.
- Net value
The total financial impact over your analysis period.
Using a 3-year horizon: implementation costs $423,000 upfront, annual costs total $295,200 over three years, but you generate $8.27 million in cumulative benefits (accounting for the 9-month ramp-up). Net value: $7.55 million, representing a 1,050% ROI that demonstrates the transformative business impact of strategic platform engineering investments.
ROI percentage
Now comes the most crucial part. How to determine the ROI percentage calculation works in the platform engineering calculator. The following is a straightforward method for calculating any ROI.
ROI% = (Net Value ÷ Total Costs) × 100
This formula measures the return as a percentage of the total investment made over the analysis period. Let’s look at the components of this simple formula. The Net Value represents the actual financial gain after accounting for all costs:
Net Value = Total Benefits - Total Costs
Using our previous example:
- Total Benefits over 3 years: $8,266,500 (with ramp-up factored in)
- Total Costs: $718,200 (implementation + 3 years of annual costs)
- Net Value = $8,266,500 - $718,200 = $7,548,300
Total costs encompass all expenditures made on the platform initiative, primarily covering implementation costs, licensing fees, and analysis expenses.
Total Costs = Implementation Cost + (Annual Costs × Analysis Period)
For our AI-Enhanced Hybrid example:
- Implementation Cost: $423,000 (one-time)
- Annual Costs: $98,400 per year
- Over 3 years: $423,000 + ($98,400 × 3) = $718,200
Based on these values, for the above example, you can find your ROI to be
ROI% = ($7,548,300 ÷ $718,200) × 100 = 1,051%
So what does this all mean? An ROI of 1,051% indicates that for every dollar invested in the platform, you will receive $10.51 in return over three years. When you look at it that way, it does not sound unreasonable, does it? This represents the net gain above and beyond recovering your initial investment.
This approach to calculation incorporates several realistic factors:
- Platform trajectory: Meaningful ROI analysis starts with identifying the returns. Considering the platform’s inflection point, escape velocity, and carrying capacity helps determine the investment needed to achieve those outcomes.
- Risk multipliers: Implementation costs are adjusted based on industry complexity, technical debt, and team readiness
- Opportunity cost: The model accounts for lost productivity during implementation, an often overlooked aspect
This ROI calculation provides a standardized method for comparing different platform approaches and justifying investments to stakeholders by quantifying the financial impact of platform engineering initiatives.
The seven-plane architecture connection
The model is grounded in the seven-plane architecture introduced in Effective Platform Engineering[1]. These planes represent the layers where investment and benefit are realized.
The seven-plane architecture offers a practical approach to understanding the scope of platform engineering, breaking it down into five horizontal planes and two vertical planes. Each horizontal plane represents a distinct capability layer where investments are made and value is realized, while the vertical planes cut across all layers to ensure consistency, visibility, and a unified product perspective. An illustration of this is provided in Figure 2 below.
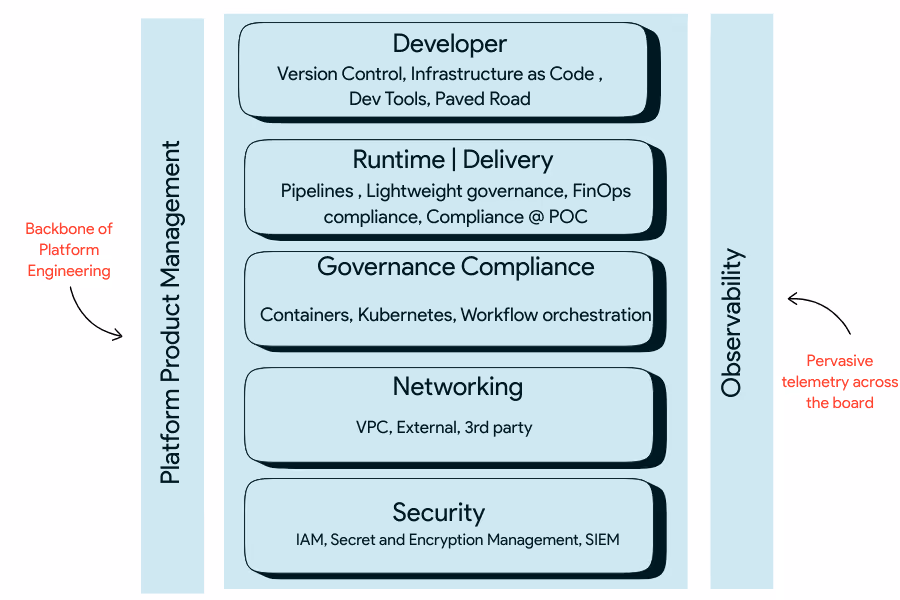
The five horizontal planes capture the foundational building blocks of a platform. The Developer plane focuses on golden paths, templates, and self-service portals that reduce friction and standardize workflows. The Runtime & Delivery plane encompasses orchestration, CI/CD pipelines, and deployment automation, making delivery predictable and scalable. The Governance & Compliance plane ensures security and regulatory adherence through scanning, policy-as-code, and compliance automation. The Networking & Connectivity plane manages service meshes, ingress, and traffic control, ensuring applications communicate reliably. Finally, the Security plane addresses secrets management, identity and access control, and cost/resource optimization—keeping the platform secure and financially sustainable.
The two vertical planes span all of these horizontal layers. Observability ensures that every aircraft is measurable, monitored, and aligned with defined SLOs. Without observability, platforms risk becoming opaque and untrustworthy. Product Management, on the other hand, ensures adoption tracking, developer satisfaction, and ROI measurement, treating the platform not as a static tool but as an evolving product that serves its internal customers.
Together, these seven planes form a holistic scope for platform engineering. They highlight that platforms are not only about runtime or infrastructure automation but also about governance, developer experience, and measurable value. By aligning investment across these planes, organizations can industrialize DevOps, reduce complexity, and maximize developer productivity.
Implementation costs draw from setup efforts across these planes. Annual benefits reflect efficiency gains in runtime, infrastructure, and security; productivity gains in the developer plane; and compounding value in product and observability. AI multipliers capture how AI augments multiple planes—from copilots in Developer, to autonomous remediation in Observability, to policy enforcement in Security.
By aligning ROI with these seven planes, the model ensures that calculations are grounded in engineering realities and are not abstract.
Platform value investment analysis
Finally, as part of conducting the platform value investment analysis, let us examine three distinct data correlations. Each of the data correlations will utilize the three investment options we explored earlier: open source, hybrid AI, and AI-native.
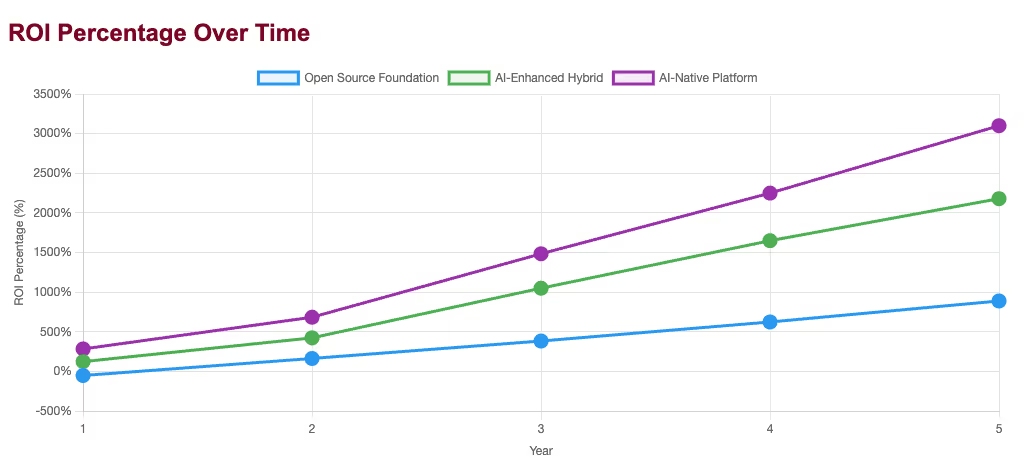
The first one we will discuss is the ROI percentage over time for each of the three options. This line chart reveals the fundamental trade-off between risk tolerance and return velocity across platform engineering approaches. The AI-Native platform demonstrates exponential ROI growth, accelerating from 285% in Year 1 to 3,100% by Year 5, indicating that early adopters of AI-first infrastructure capture disproportionate value as the technology continues to compound. The AI-Enhanced Hybrid approach follows a more conservative yet still aggressive trajectory, achieving a 2,180% ROI by Year 5, which suggests a balanced risk-return profile for organizations seeking substantial gains without excessive exposure. The Open Source Foundation path starts with a concerning -50% ROI in Year 1, reflecting the hidden costs and time investment required for custom implementation, but recovers to achieve a respectable 890% ROI by Year 5, demonstrating that patient capital and strong technical capabilities can eventually yield solid returns despite initial setbacks.
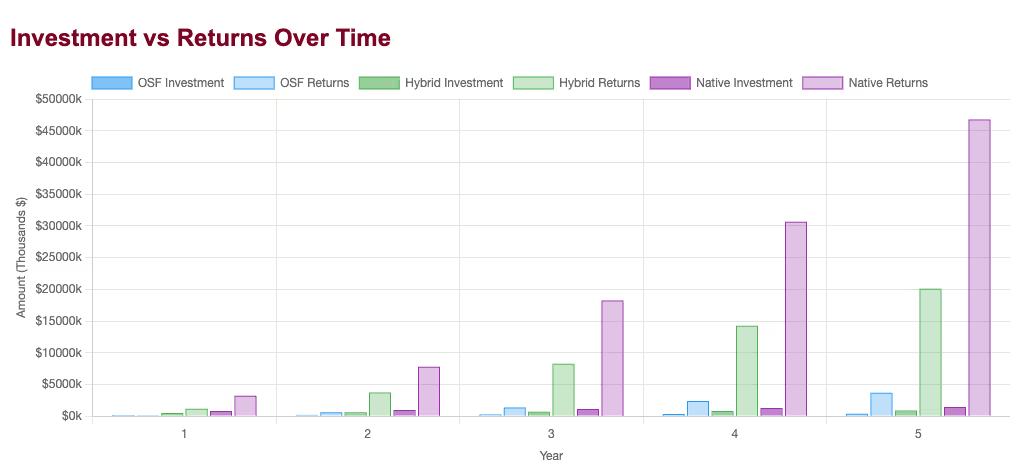
Next, we will examine the investments versus returns over a five-year period. The bar chart exposes the capital intensity required for each approach and challenges common assumptions about "cheap" open-source solutions. While OSF appears to have the lowest investment requirements (peaking at $ 375,000 by Year 5), it generates proportionally modest returns ($3.7 million), resulting in a 10:1 return-to-investment ratio. The AI-Enhanced Hybrid approach requires moderate capital commitment ($913k by Year 5) but generates substantial returns ($20.1M), achieving an impressive 22:1 ratio that suggests optimal capital efficiency for most organizations. The AI-Native platform demands the highest investment ($1.46M by Year 5). Still, it produces extraordinary returns ($46.8M), delivering a 32:1 ratio that justifies the premium for organizations with sufficient capital and aggressive growth targets, while also highlighting the risk of substantial losses if implementation fails.
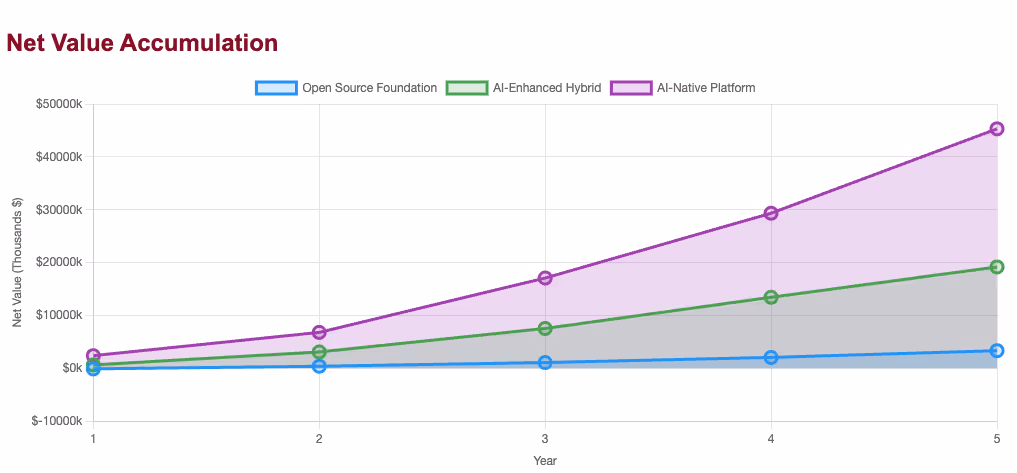
Lastly, the key takeaway is the accumulation of net value. This area chart illustrates the actual wealth creation potential after accounting for all costs, revealing stark differences in absolute value generation that ROI percentages alone obscure. The AI-Native platform creates $45.3M in net value by Year 5, representing a genuine enterprise transformation that can fund additional strategic initiatives and competitive advantages. The AI-enhanced hybrid generates $19.2M in net value, providing a substantial business impact while maintaining manageable implementation complexity and risk exposure. The OSF approach generates $3.3M in net value, which, although respectable for smaller organizations, may not justify the opportunity cost and technical debt accumulation for enterprises that could afford higher-return alternatives, particularly given the negative value creation in Year 1, which could strain organizational patience and commitment to platform engineering initiatives.
Architecture of the current model
We built this model as a simple exercise, wanting to respond meaningfully to some of our clients. However, there are many components one should consider as part of this. Figure 7 below illustrates the various layers that comprise this architecture. The tech stack we used primarily consists of simple technologies, including HTML, CSS, JavaScript, Chart.js, TypeScript, Node.js, and MCP SDK [21].
Both the visual and CLI stacks use the same backend engine for consistency.
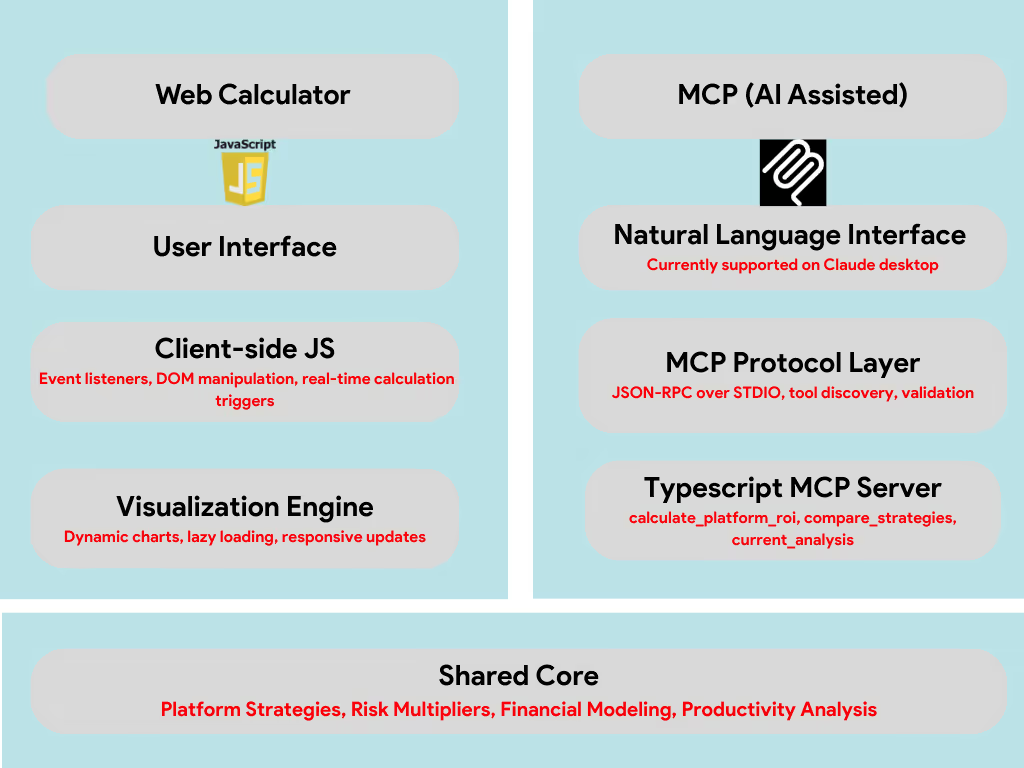
As a user, we recommend choosing Web Calculator for Visual analysis, scenario exploration, presentations, team workshops, and detailed parameter investigation.
You should choose the MCP Server for: Quick strategic queries, AI-integrated workflows, executive briefings, conversational analysis, business planning integration, and team building.
Democratizing the ROI value across the organization
As we developed and tested this model in organizations, one of the challenges was understanding how and why ROI-related decisions were being made within specific organizations. To address this, we developed an MCP server for the Platform ROI model. While the Platform ROI Calculator MCP server may not represent the optimal use case for Model Context Protocol implementation in the first place, given that ROI calculations are typically infrequent, strategic exercises rather than operational workflows, it addresses a critical organizational challenge: building a consistent understanding and shared mental models across diverse stakeholders with varying technical backgrounds and business priorities.
The primary limitation lies in usage frequency: platform engineering ROI analysis occurs quarterly or annually, rather than daily, which reduces the conversational advantage that MCP servers typically provide. However, this infrequency creates a different problem: organizational misalignment. When platform engineering discussions occur sporadically across various teams, each using different assumptions, methodologies, and data sources, the result is fragmented decision-making and inconsistent strategic direction.
The MCP server's value emerges from standardizing these conversations. Rather than having executives use one set of assumptions, engineering leaders use another, and product teams develop their own informal calculations. The tool creates a unified analytical framework that is accessible through natural language, spanning organizational boundaries. This consistency becomes particularly valuable during cross-functional planning sessions where platform investment decisions require alignment between finance, engineering, product, and executive stakeholders who may lack shared technical vocabulary but can engage through conversational queries.
The integration demonstrates how AI-native tools can bridge organizational silos, not just through data access, but also through democratized analytical capabilities that enable informed participation in strategic discussions, regardless of technical background or analytical expertise.
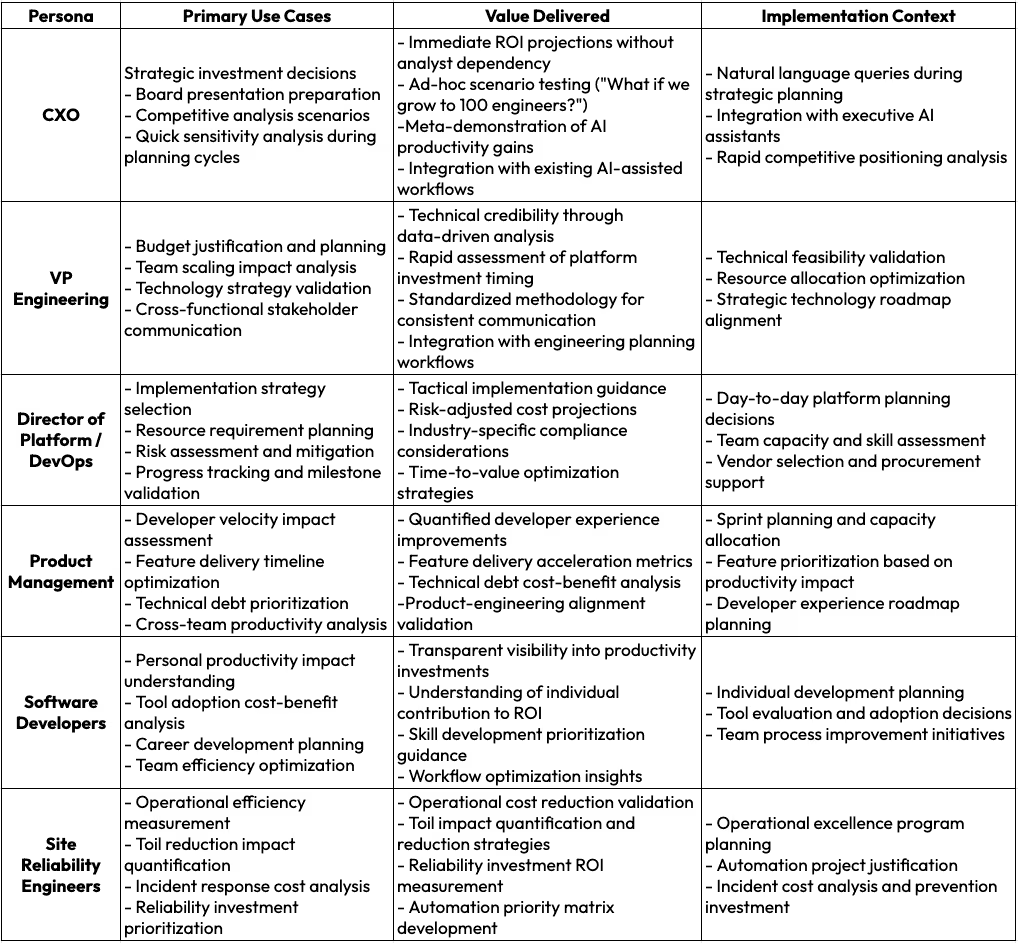
Let us first talk about the value of this data across various personas and follow that up with how to set up a consistent installation and dissemination of data for organizational alignment.
Value proposition by organizational persona
As you democratize access to this data across the organization, knowing the ROI will benefit not just the CXO or those who are funding the platform engineering initiatives. This is not only required for, but also essential for, all the stakeholders. Let's examine the table below to assess the potential benefits across the board.
Cross-persona integration benefits
- Organizational alignment
The MCP server creates a shared analytical framework that enables consistent ROI discussions across organizational levels. Rather than different personas using different methodologies or assumptions, the standardized approach ensures strategic alignment from C-level planning to individual developer productivity optimization.
- Decision velocity
By embedding ROI analysis within existing AI-assisted workflows, the tool reduces the friction associated with financial justification processes. This acceleration becomes particularly valuable during rapid scaling phases or competitive pressure situations where platform investment decisions require quick validation.
- Cultural transformation
The MCP server demonstrates AI-native business processes, supporting broader organizational transformation toward AI-augmented operations. This meta-value becomes particularly significant for organizations that incorporate platform engineering investments into larger digital transformation initiatives.
Installing the MCP server the right way
In enterprises that want to implement the ROI MCP server, there are multiple approaches to approach it.
- Large organizations with dedicated platform teams might want to install it centrally, where the MCP servers might be deployed on its internal infrastructure and the data could be exposed via internal APIs. Here, the Claude instances are typically configured to centralized endpoints. All of this leads to a single source of truth.
- On the other extreme is a distributed local installation, where each user installs the MCP server locally using a standardized installation package, and the configuration is managed through enterprise device management. We also know that most current MCP implementations require local installation because they use stdio transport rather than network protocols.
- Our recommended approach will be to take a hybrid approach with remote MCP servers, which is an emerging pattern. As IT teams develop remote MCP servers using HTTP/WebSocket instead of stdio, Enterprise MCP gateways that proxy between Claude and internal services are pretty standard. At that point, containerized MCP services are deployed on internal platforms.
For example, a centralized configuration could look like this:
{
		"mcpServers": {
    		"platform-roi": {
        	"type": "http",
          "url":
"https://internal.mycompany.com/platform-roi",
			"auth": {
      	"type": "bearer",
        "token": "${COMPANY_MCP_TOKEN}"
      }
    }
  }
}
The standardized local deployment could be as simple as this:
# IT-managed installation
scriptcurl -s
https://internal.mycompany.com/mcp/install-platform-roi.sh | bash
# Automatically configures with company defaults:
# - Salary bands by role/location
# - Industry-specific multipliers
# - Approved platform strategies
Potential enhancements
So, where do we go from here? What we have done is merely to scratch the surface of this seemingly vast area of valuable research, which has been the bane of platform engineering’s existence.
Future enhancements and research directions
The Platform ROI Calculator represents an initial framework that requires substantial evolution to address the complex dynamics of platform engineering investment decisions. Current limitations stem from static parameter assumptions and insufficient longitudinal validation data. Future enhancements must focus on dynamic data integration, where real-time organizational metrics replace manual inputs, and predictive modeling capabilities that account for implementation risk distributions and benefit realization curves based on actual outcome data, rather than relying on industry averages.
The most significant research gap lies in the empirical validation of AI productivity multipliers. Current assumptions about 1.5 to 1.75 times productivity gains from AI-enhanced platforms lack rigorous longitudinal study validation. As AI tools mature and organizational adoption patterns stabilize, these multipliers may prove either overly optimistic or insufficiently ambitious. Research partnerships with organizations implementing platform strategies could provide the data necessary to accurately calibrate these factors, particularly regarding the sustainability of productivity improvements over multi-year periods and the impact of AI skill development on effectiveness.
MCP integration with Retrieval-Augmented Generation
The convergence of MCP servers with RAG architectures presents compelling opportunities for platform engineering decision-making that extend far beyond simple ROI calculations. MCP servers could serve as intelligent gateways to organizational knowledge bases, enabling AI assistants to retrieve and synthesize information from disparate sources, including implementation case studies, vendor documentation, internal post-mortems, and industry benchmarking data. This integration would transform platform planning from isolated calculations to contextually aware analysis that incorporates lessons learned from previous implementations, current vendor capabilities, and peer organization experiences.
RAG-enhanced MCP servers could dynamically update calculation parameters based on emerging research, real-time market conditions, and organizational context. Rather than relying on static multipliers, the system could query recent implementation outcomes from similar organizations, adjust risk factors based on current vendor stability and support quality, and incorporate regulatory changes that affect compliance overhead. This approach would address the fundamental limitation of static models in rapidly evolving technology landscapes. See Figure 8 for a futuristic view of RAG-enhanced MCPs.
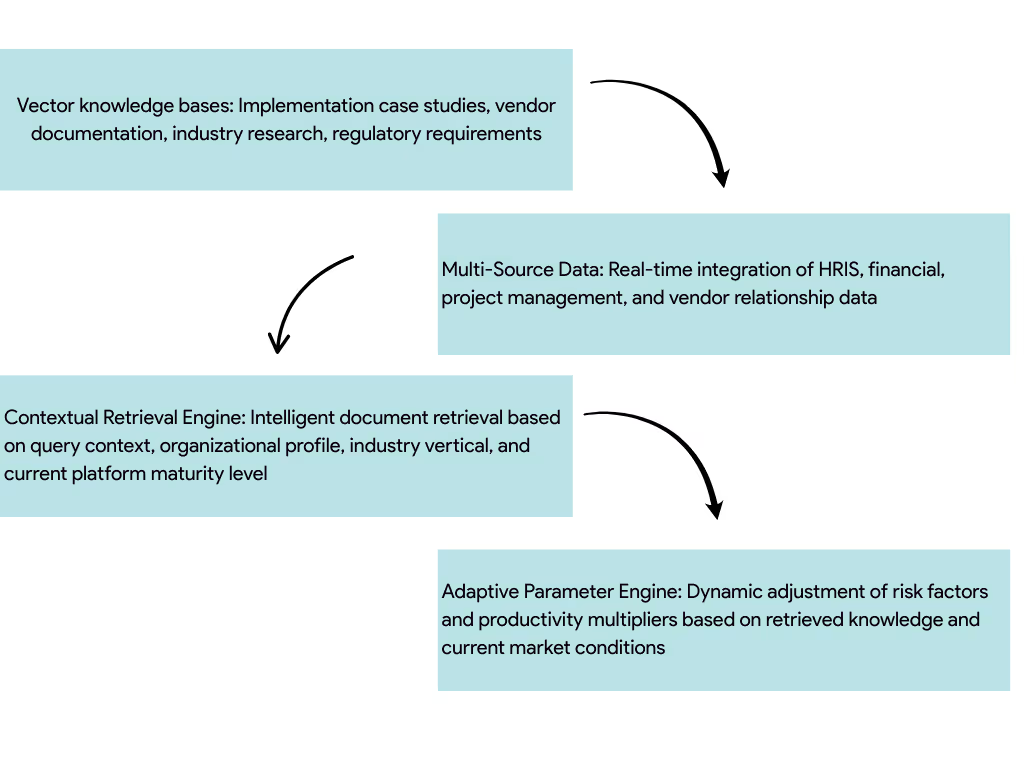
The most valuable application would involve MCP servers that integrate multiple organizational data sources through RAG architectures to provide holistic platform engineering guidance. These systems could synthesize information from HRIS systems for actual team composition and compensation data, project management tools for absolute toil measurement, financial systems for budget constraints, and vendor relationship management systems for procurement context. The resulting analysis would move beyond generic ROI projections to organization-specific recommendations that account for existing technology investments, team capabilities, vendor relationships, and strategic priorities.
This evolution toward RAG-integrated MCP servers represents a shift from transactional calculation tools to strategic advisory systems that continuously learn from organizational experiences and industry developments. However, the success of such systems depends on establishing data governance frameworks that balance analytical value with privacy requirements, particularly when dealing with sensitive financial and personnel information across organizational boundaries.
Conclusion
Platform engineering is often framed as an internal cost center. The Platformetrics ROI Model demonstrates the opposite: when measured systematically, platform engineering delivers outsized returns. We are seeing some interesting developments in the industry where a significant part of R&D spending is being channeled to platform engineering[10]
By diagnosing today’s inefficiencies (Productivity Loss, Current Productivity, AI Opportunity, and Efficiency Gap), comparing multiple investment paths, and grounding the math in the seven-plane architecture, the model provides leaders with a concrete and defensible basis for decision-making.
Treating platforms as products—complete with real costs, tangible benefits, and real ROI—transforms them from enablers into engines of enterprise value. We have identified the flaws in this model and the opportunities for enhancement within your organization. We look forward to collaborating with you to develop improved versions of this that will evolve with your platform's growth.
Model availability
This model is available free of charge to all readers directly from the Platformetrics website, accessible at https://platformetrics.com/platform-roi.html. We encourage you all to test it out in your organizations and share your feedback with us so we can improve this model. Contact us if you want to download our MCP server from our public GitHub repository.
References
- Effective Platform Engineering, Manning Publications, 2025 - Effective Platform Engineering - Ajay Chankramath, Nic Cheneweth, Bryan Oliver, Sean Alvarez
- Platform Value Model, ITRevolution, 2024 - Measuring the Value of Your Internal Developer Platform Investments - IT Revolution
- Humanitec ROI: Return on investment (ROI) | Humanitec
- Jellyfish ROI: Jellyfish ROI Calculator
- Faros: Faros AI for AI Leaders | AI Impact, ROI and Governance
- GetDX: AI coding tools ROI calculator: Measure your development team’s productivity gains
- Platform.sh: https://platform.sh/roi-calculator
- Opsera: Opsera DevOps ROI Calculator
- Mia-Platform: Measuring the ROI of Platform Engineering
- GetDX: The case for investing 50% of R&D spend in platform engineering work
- LinearB: ROI Calculator | LinearB
- PluralSight, ROI: How to measure L&D program value for organizational success
- CodeClimate: How We Ensure Success | Code Climate
- Swarmia: Measuring the productivity impact of AI coding tools: A practical guide for engineering leaders | Swarmia
- Tabnine: Measuring productivity in an AI world - Tabnine
- Replit: AI ROI Calculator
- Harness: ROI Calculator
- Gitlab: Return on Investment Calculator
- Platformetrics: Platformetrics
- Measuring the Impact of Early-2025 AI on Experienced Open-Source Developer Productivity - METR
- SDKs - Model Context Protocol